General Information
Documentation
REST API: https://api.acuitytrading.com/swagger/index.html
Streaming (WebSockets) API: https://api.acuitytrading.com/Streaming
API Transactions
Sentiment data can be retrieved using the following API transactions from the REST API:
RelativeIndex
This is the simpler endpoint and it returns 2 data points:
- Percentage Positivity
This data point returns the latest percentage of bullish (financial positivity) news from all
sentiment-charged news for a given period (either daily or hourly). The logic is as follows:
- Obtain the positive value (in this case it is of Bullish sentiment type or ID 13 from
the Sentiment API) - Obtain the negative value (in this case it's Bearish sentiment type or ID 14 from the
Sentiment API) - The returned value is calculated using the following formula: Positive Value /
(Positive Value + Negative Value) * 100%
- Obtain the positive value (in this case it is of Bullish sentiment type or ID 13 from
- Percentage Popularity
sentiment-charged news for a given period (either daily or hourly). The logic is exactly
the same as above, where only the sentiment types are different:
- Positive value is of sentiment type ID 17 (Positivity)
- Negative value is of sentiment type ID 22 (Negativity)
The other API transactions in this endpoint allow getting the above sentiment values using a
predefined Watchlist (a named list of instruments saved on an account) or using a list of assets
(Multiassets).
Sentiment
This is a more general API endpoint that returns various raw sentiments calculated by Acuity.
See below for additional information on supported sentiment types.
Sentiment Types
| Sentiment ID | Sentiment Name | Description |
| 12 | Feel Good Factor | The logarithmic ratio between Positivity and Negativity. This sentiment type is currently used in the Research Terminal Radial Gauges and multiple other widgets to show the current sentiment levels per asset. |
| 13 | Bullish | This sentiment type is also referred to as "Financial Up". In other words this is the sentiment type that measures positivity using specific financial terminology and financial media. |
| 14 | Bearish | This sentiment type is also referred to as "Financial Down". This is the opposite of the above type. |
| 16 | News Volume | This sentiment type returns the absolute article count per asset per requested time period. |
| 17 | Positivity | This sentiment type measures the general positivity in the media as related to a specific asset. |
| 20 | Hype | This sentiment type measures the amount of popularity or hype related terminology per asset. |
| 21 | Fear | This sentiment type measures the amount of fear or volatility related terminology per asset. |
| 22 | Negativity | This sentiment type measures the general positivity in the media as related to a specific asset. |
| 25 | RVT | Relative Volume of Talk is a calculation pertaining to the number of mentions concerning a specific financial instrument, divided by the total number of news items collected over a given period. |
| 26 | EMA Feel Good Factor | Exponential Moving Average over the Feel Good Factor. Uses 7 days as the lag for daily calculations and 48 hours as the lag for hourly calculations. |
| 24 | Feel Good Factor v2 | The modified version of the Feed Good Factor score. |
| 33 | RCV | Relative Change Volume computes the change in terms of volume, i.e. the relative change concerning the mean volume received over a 90- day period. |
Use Cases
General Positivity Percentage
Use the logic described in the RelativeIndex API endpoint guide to calculate the percentage of generally positive news or financially positive news. Please make sure to use the matching positive / negative types for a more accurate score (e.g., use Positivity AND Negativity or Bullish AND Bearish in the same calculation).
Example:
- Get the list of supported asset classes using the GET /api/sentiment/assetclass endpoint in
the Swagger doc. - Get the list of supported asset IDs using the specified asset class using the GET /api/sentiment/asset endpoint. For example, let's choose EURUSD (asset ID: 50).
- Using the POST /api/percentagepositivity/multiassets endpoint we can send the following request body:
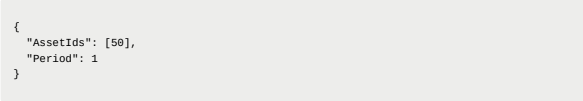
"Period": 1 is requesting Daily values (0 is for Hourly values). Please note that Equities
asset class only supports daily values (hourly will be returned but they will be identical
for the whole day as are only calculated once a day). - The response will contain the following:
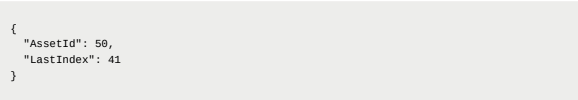
LastIndex value is the percentage of financially positive news for the given period (last
hour or last day). Calculated using the logic described above ( Bullish / (Bullish + Bearish)
* 100 )
Sentiment Radial Gauges
Sentiment radial gauges are generally used in Acuity and Signal Stream widgets to show the
percentage of positive and negative news and the change of the sentiment values since the
previous period (either day or hour).
Here is an example of how the sentiment radial gauges are displayed:
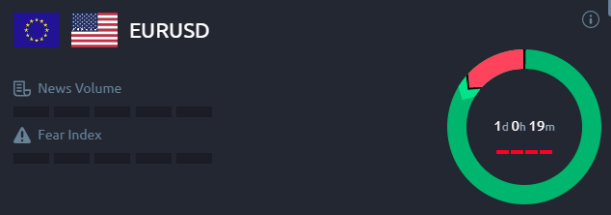
To calculate these radial gauges the following logic is used:
- Using the above example of EURUSD (asset ID: 50), get the most recently available Feel
Good Factor (sentiment type ID: 12) value and T-1 value (e.g., yesterday's value if getting
daily scores or last hour's value if getting hourly scores) using the POST /api/sentiment/value/multiassets endpoint AND the scores for the last 3 months (if using
daily frequency) or last month (if using hourly frequency). The request body example: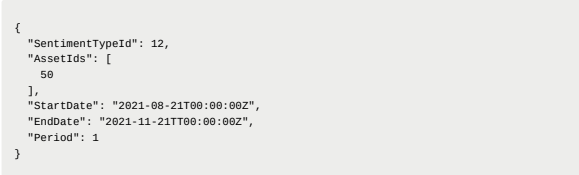
- The values that you need to get would be following:
- current value = latest value / average of last 90 days values (if using hourly frequency it would be latest value / average of last 30 days daily values).
- previous value = same as above but for T-1 (1 day or one hour before the last value).
- Process the current and previous value according to the following logic:
- To calculate the percentage of positivity use the following logic: round((value + 1) * 50) In
the above image it's at 85%. - Do the same for the previous value and you will be able to get the direction of the change.
Previous value was at 86% (sentiment moved 1% towards general negativity since
yesterday).
Fear Index
Fear Index is a measure of volatility related terminology in the news media per each asset. It is
generally useful to compare the current level of fear in the media towards the average to see if
there is increased or decreased perceived volatility for an asset. To do this, use the following
logic.
- Using the above example of EURUSD (asset ID: 50), get the most recent Fear sentiment
value (sentiment type ID: 21). - Get the last 30 (or 90) daily values, depending on your general requirements. Same API request as above can be used (simply replace the sentiment type).
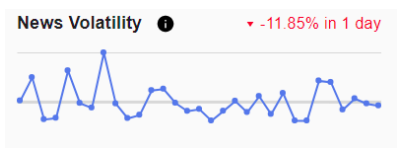
- Compare the current Fear index value with the average. This can be plotted in the following way (this shows current perceived volatility being slightly lower than the average value for the last 30 days):
- To calculate the Fear Index Bars (similar to what is available in the Research Terminal), the
following logic needs to be applied:- Daily Values:
- For daily values it is necessary to compare the latest value with last 90 days values, like with the general sentimentю
- Round the result using the following logic: round(last_daily_value / average_value *
100, 2) - Convert the result to bars using the following logic:

- Hourly Values:
- For hourly values it’s necessary to compare the latest value with the last 2 week’s worth of hourly values (i.e. last 360 hours)ю
- Round the result using the same logic as above.
- Convert the result using the same logic as above.
- Daily Values:
News Volume Index
News Volume can also be compared to its average readings to see if there is an increased
coverage per specific asset. Coupled with other sentiment types it could be a useful way of finding trading strategies.
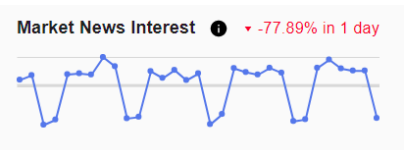
To get the average news volume, use the same logic as above, but use sentiment type 16 (News
Volume). The result can be plotted this way:
Other options for this goal is to use the following sentiment types:
- RVT (Relative Volume of Talk). Some instruments (like F(M)AANG or FX Majors) are
going to be dominating the coverage generally, so using this it will be easier to see if the
coverage volume is the same as always or higher/lower (in absolute terms). - RCV (Relative Change Volume). This score returns the change in volume, where latest
readings are compared against the 90 day average.
NOTE: News Index Bars (similar to Research Terminal’s version) can be calculated using the
same logic as the Fear Index above.
Sentiment vs. Price Comparison
It can be useful to compare Sentiment movements with the asset price to produce something like the following:
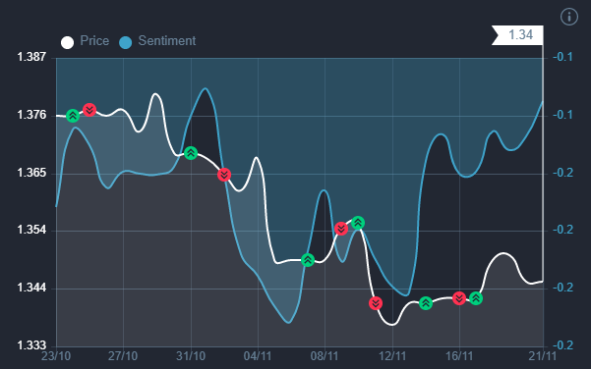
To do this, do the following:
- Get the asset price for the asset in question.
- Using the Sentiment API get the EMAFeelGoodFactor sentiment values (sentiment type ID 26).
- Plot the sentiment chart and the price chart side by side to see how movements in sentimentcan provide signals for where the price might move.
If you haven't found what you're looking for yet, don't worry! Our team is here to assist you.