Video Guide
Written Guide
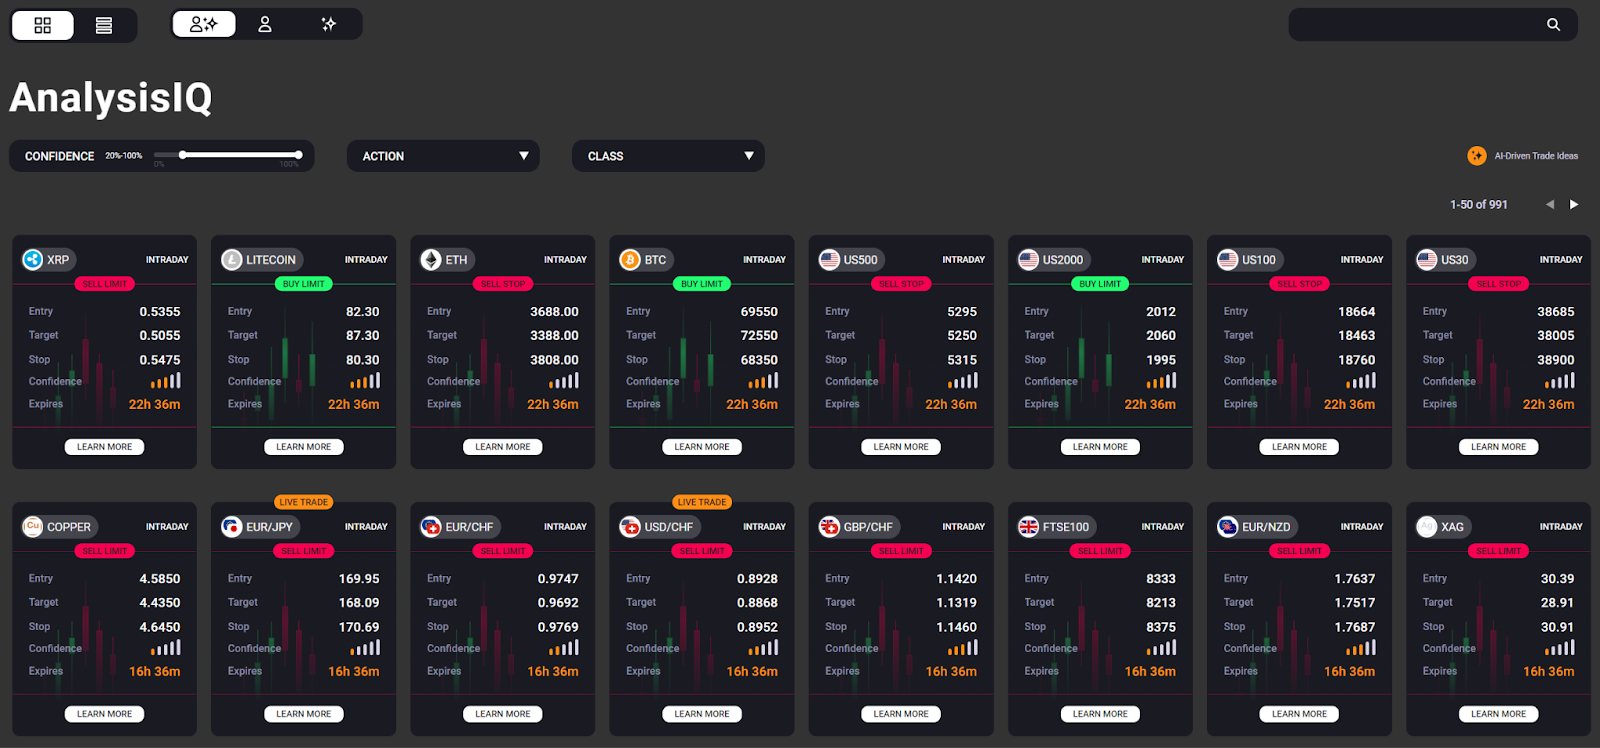
Welcome to AnalysisIQ, your gateway to high-quality trade ideas and expert market analysis.
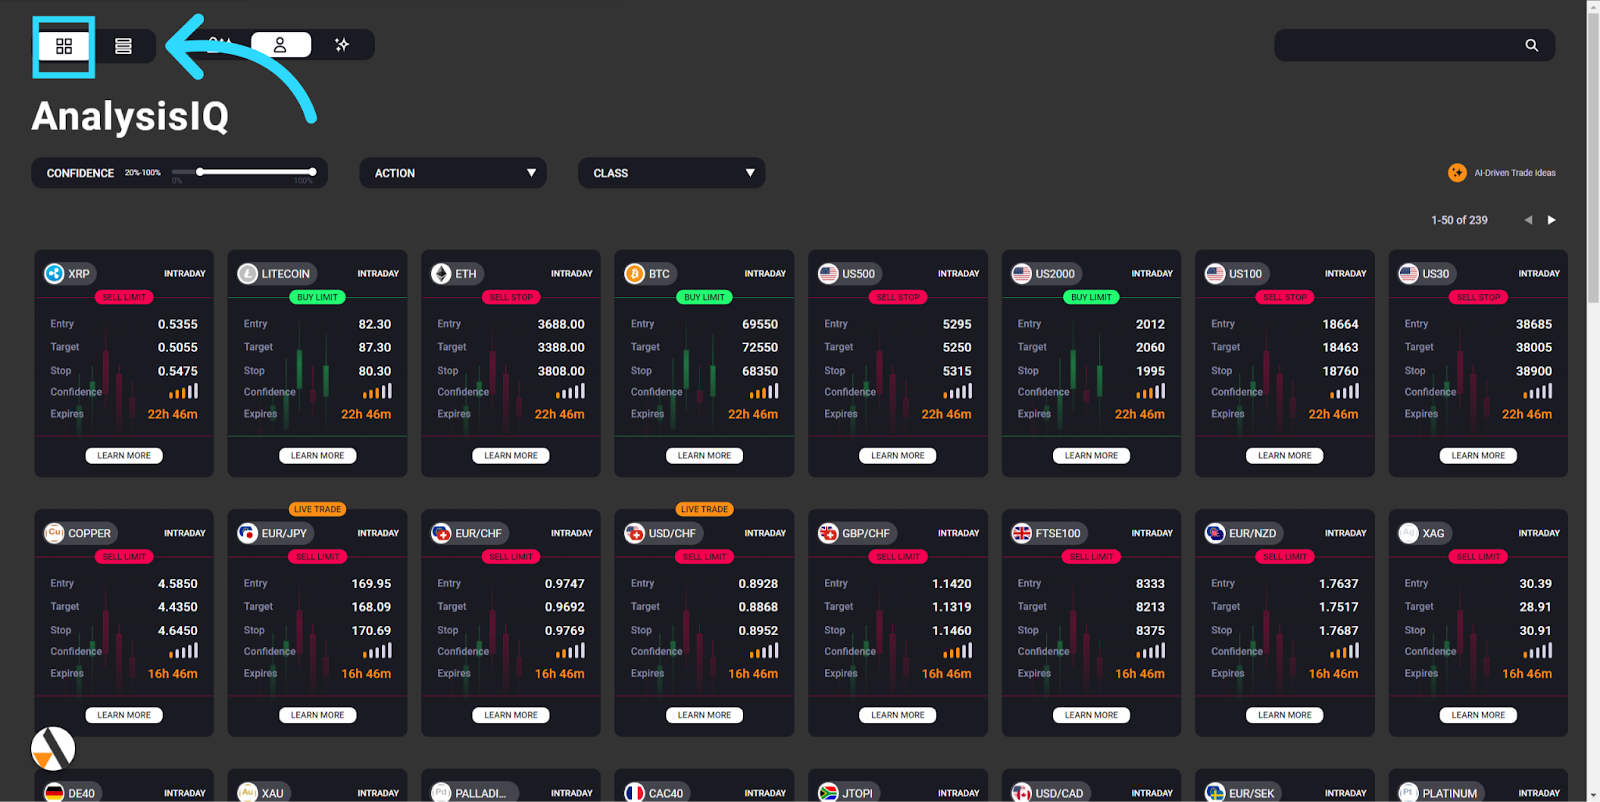
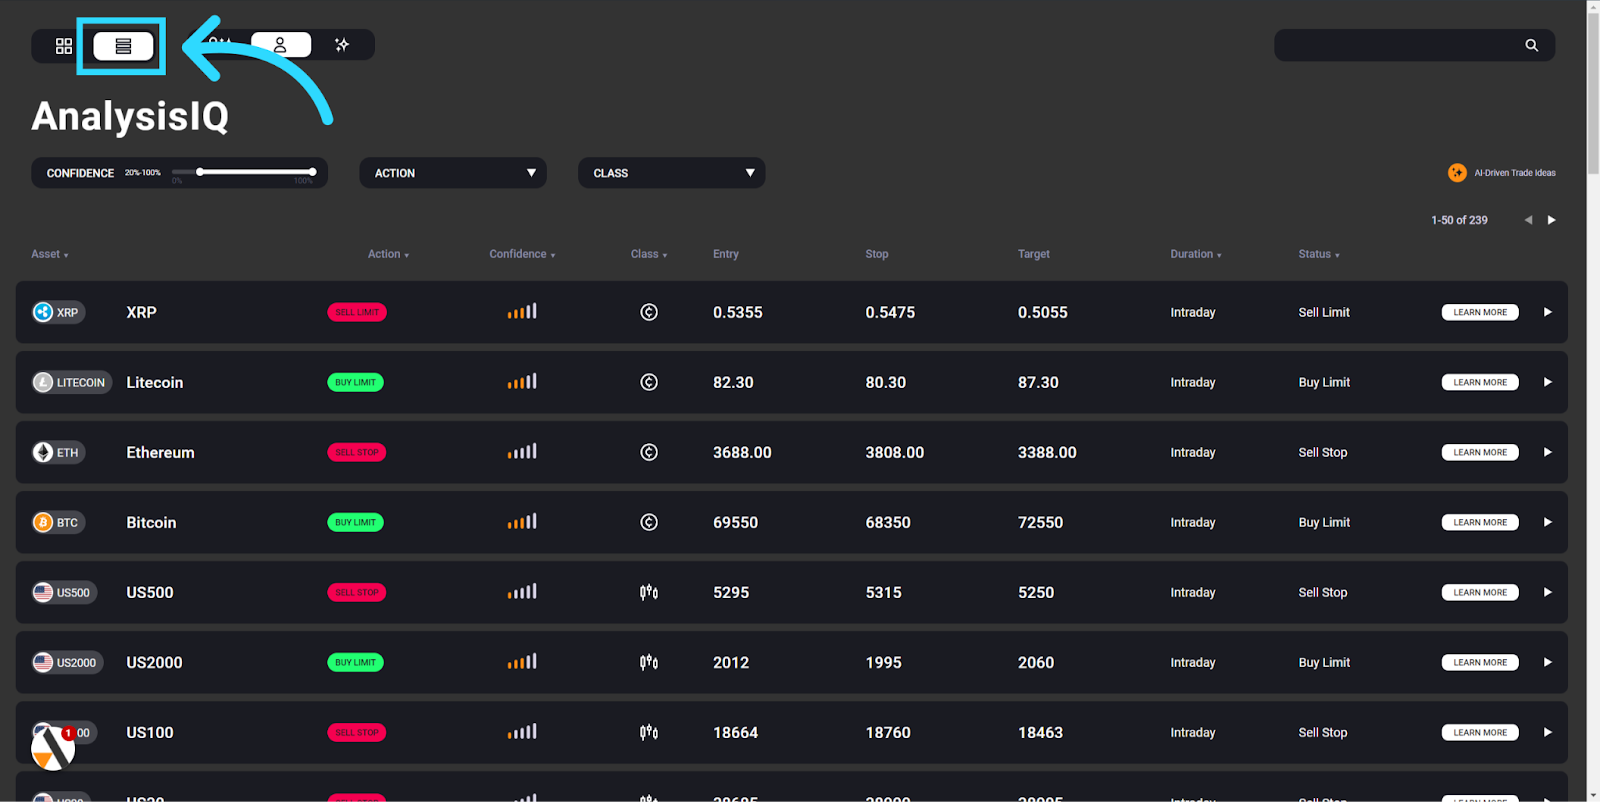
Navigation
Easily navigate between List or tab view to find the trade ideas that suit your preferences.
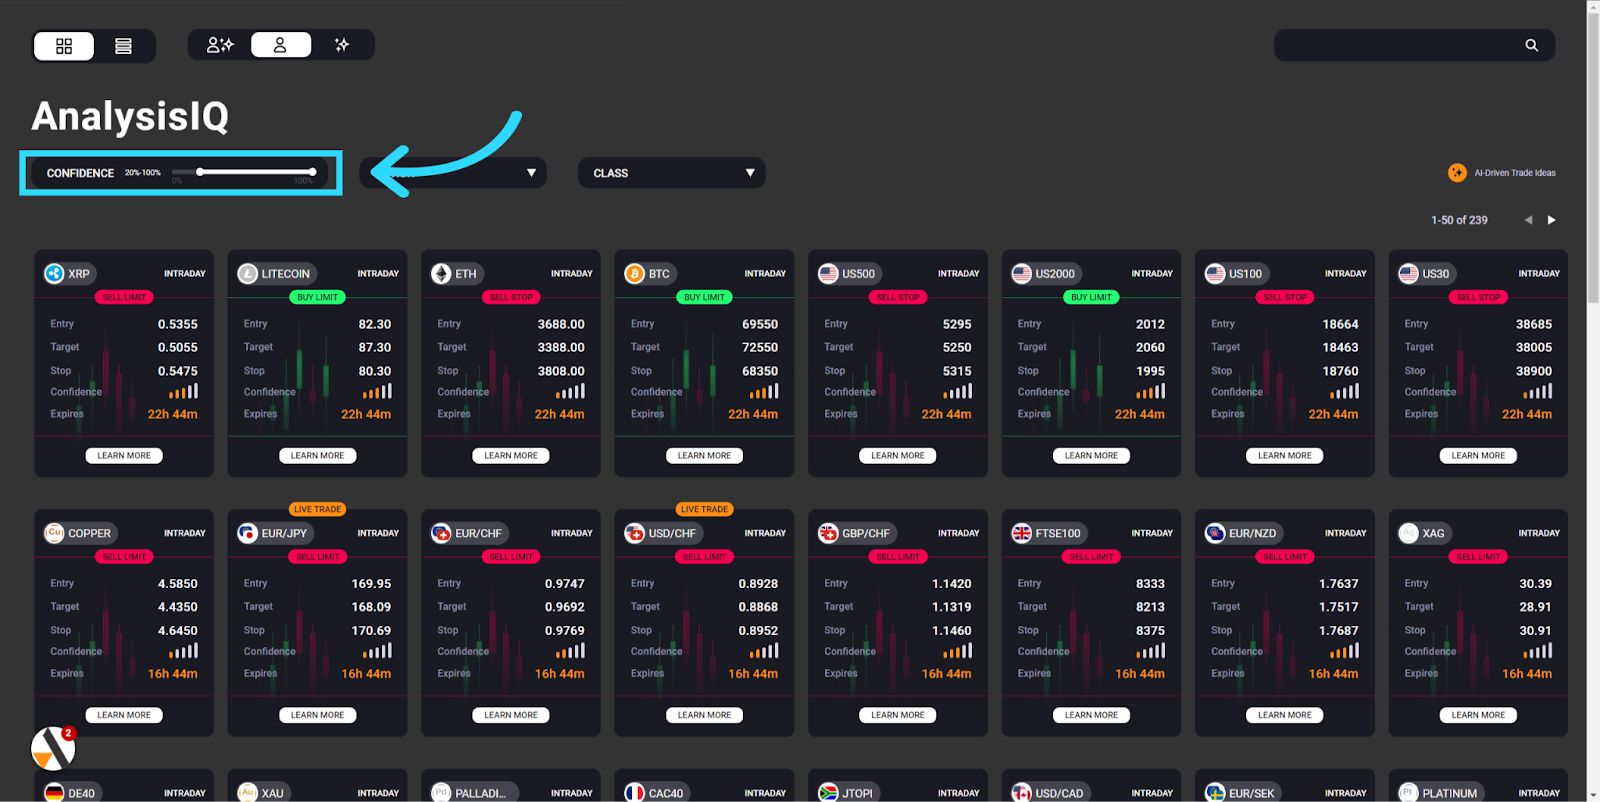
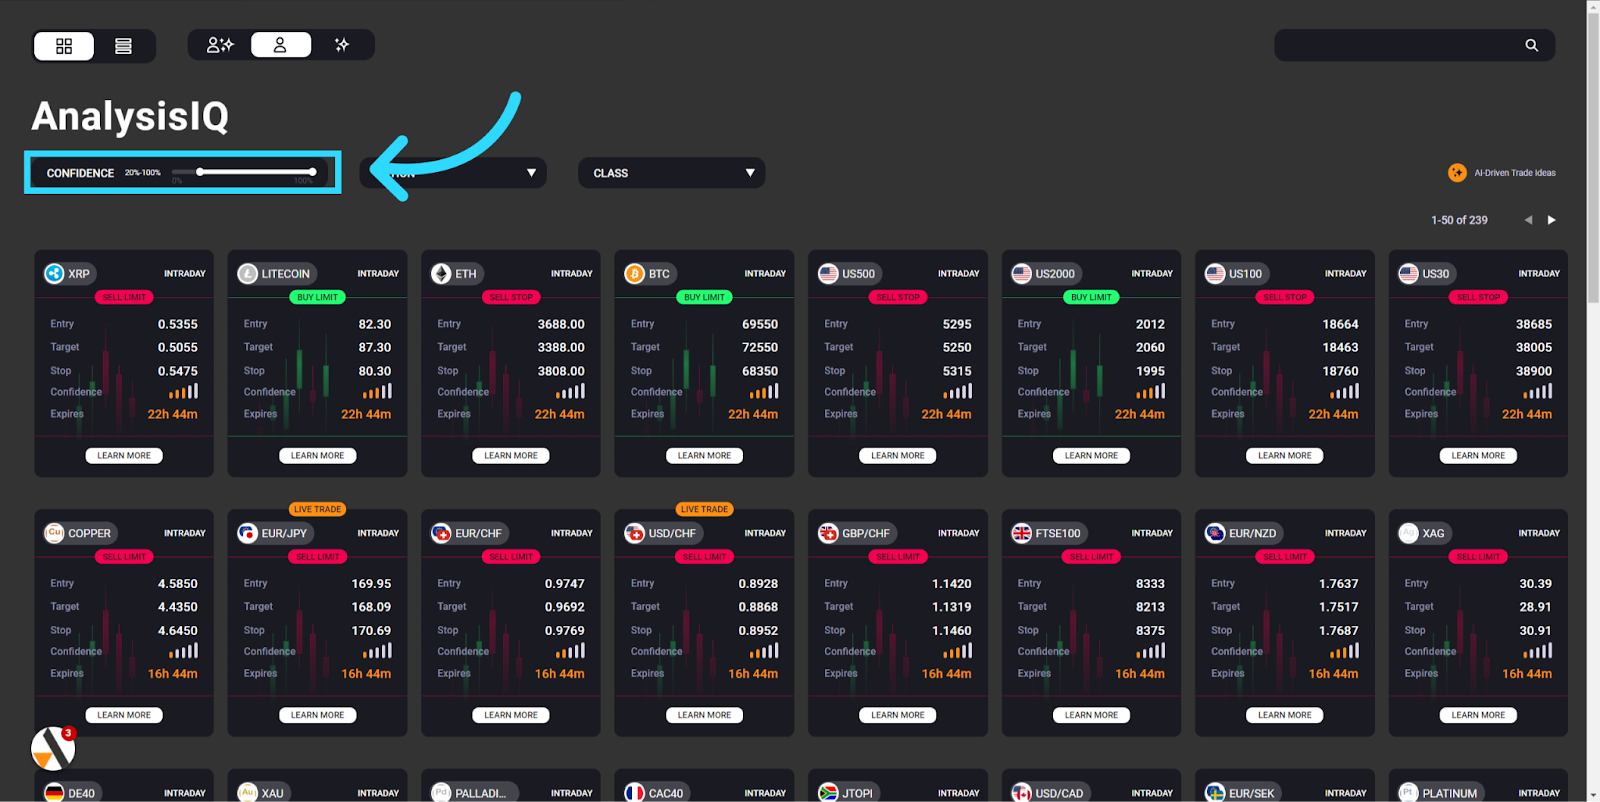
Confidence
The confidence bar allows you to filter trade ideas between 0% - 100%, which is calculated using a proprietary formula. The metrics Includes trend, analyst performance and sentiment analysis data.
Confidence Ratings
Trade ideas come with confidence ratings ranging from 20% to 80%. Lower confidence ratings usually indicate trades against the current trend. While riskier, these trades can offer substantial rewards if successful. Higher confidence ratings suggest trades in line with the current trend, providing more stable opportunities.
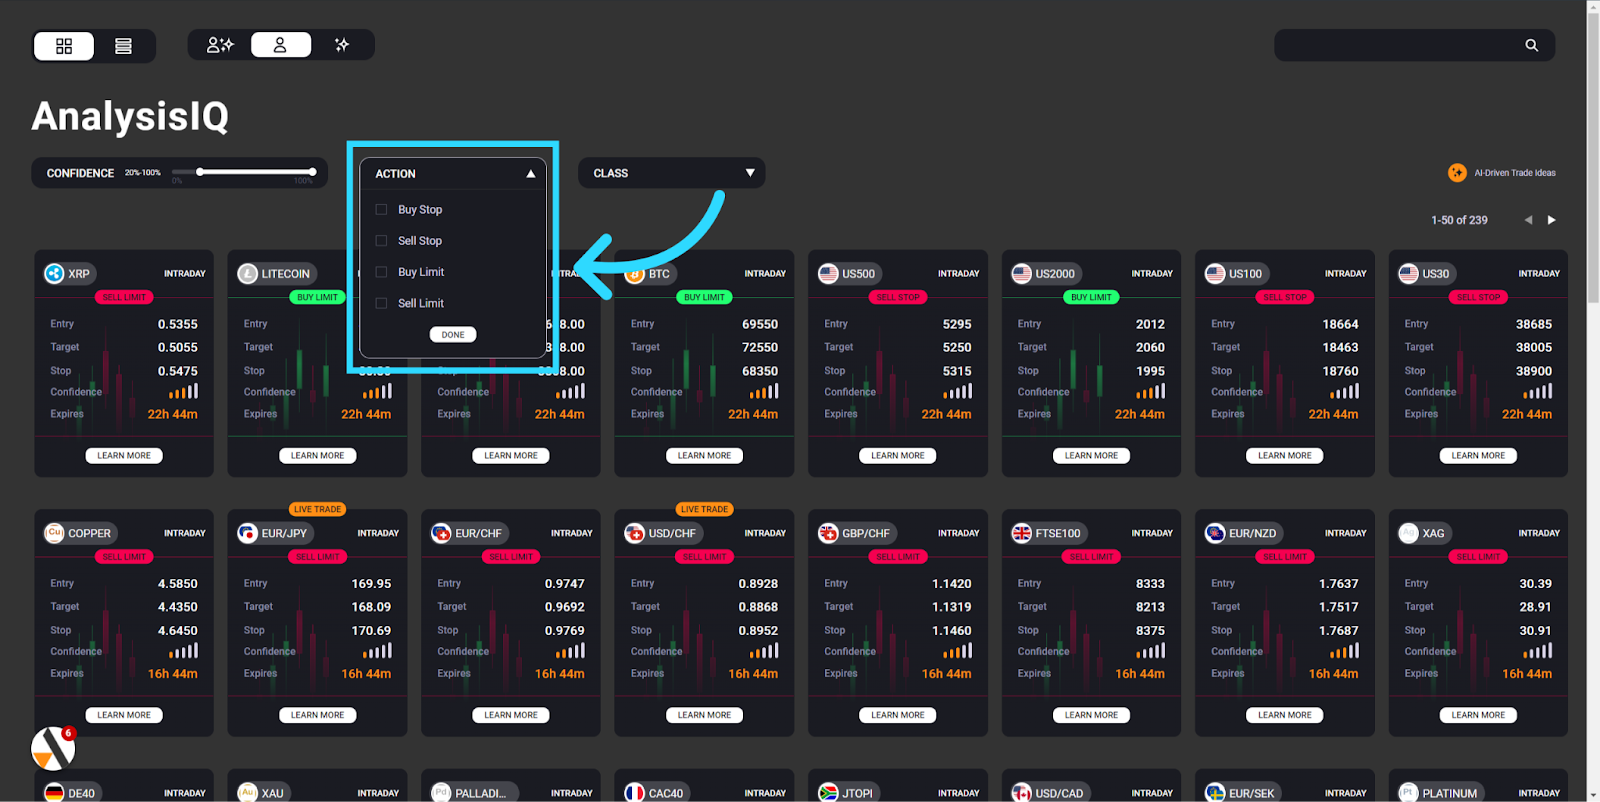
Action
The action filter allows traders to select a Trade idea based on its entry type.
Order types
We cover 4 types of orders, Buy Limit, Sell Limit, Buy Stop & Sell Stop.
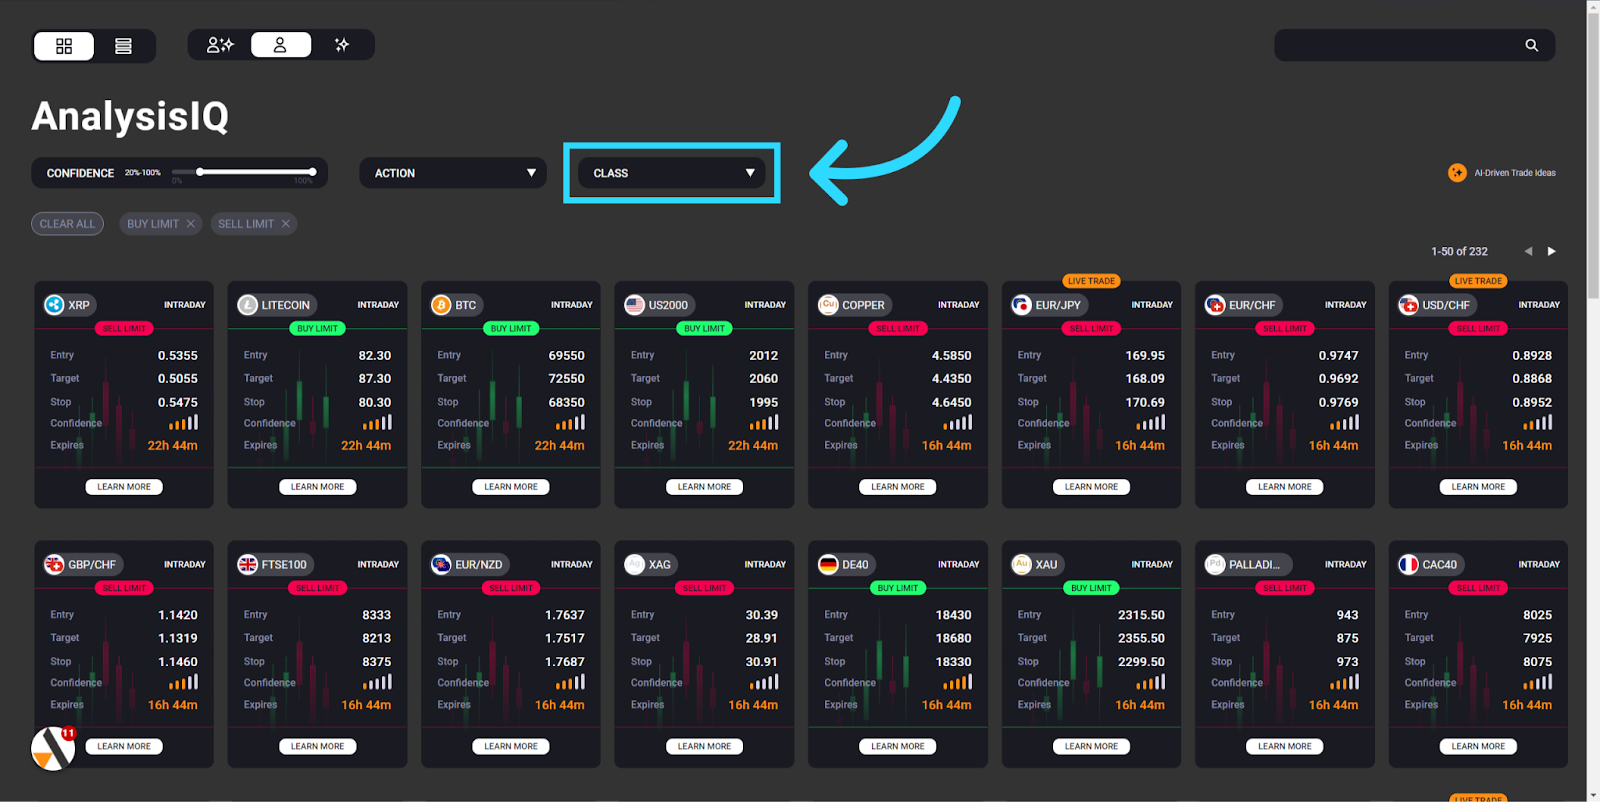
Class
The Class tab allows traders to filter by the type of asset they are most interested in.
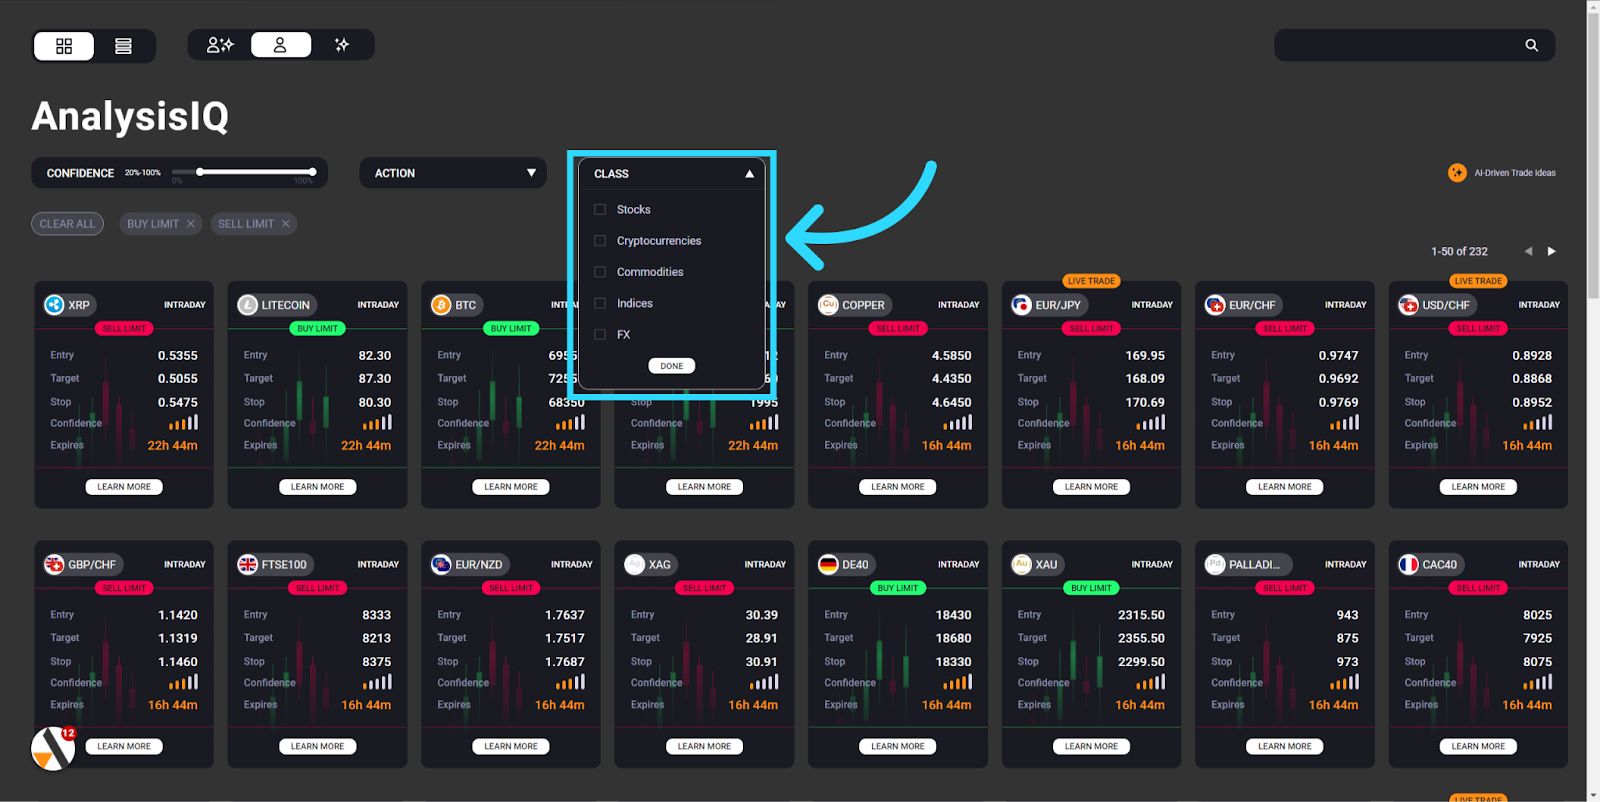
Asset Class
Choose from FX, Commodities, Indices, Cryptocurrencies or Stocks.
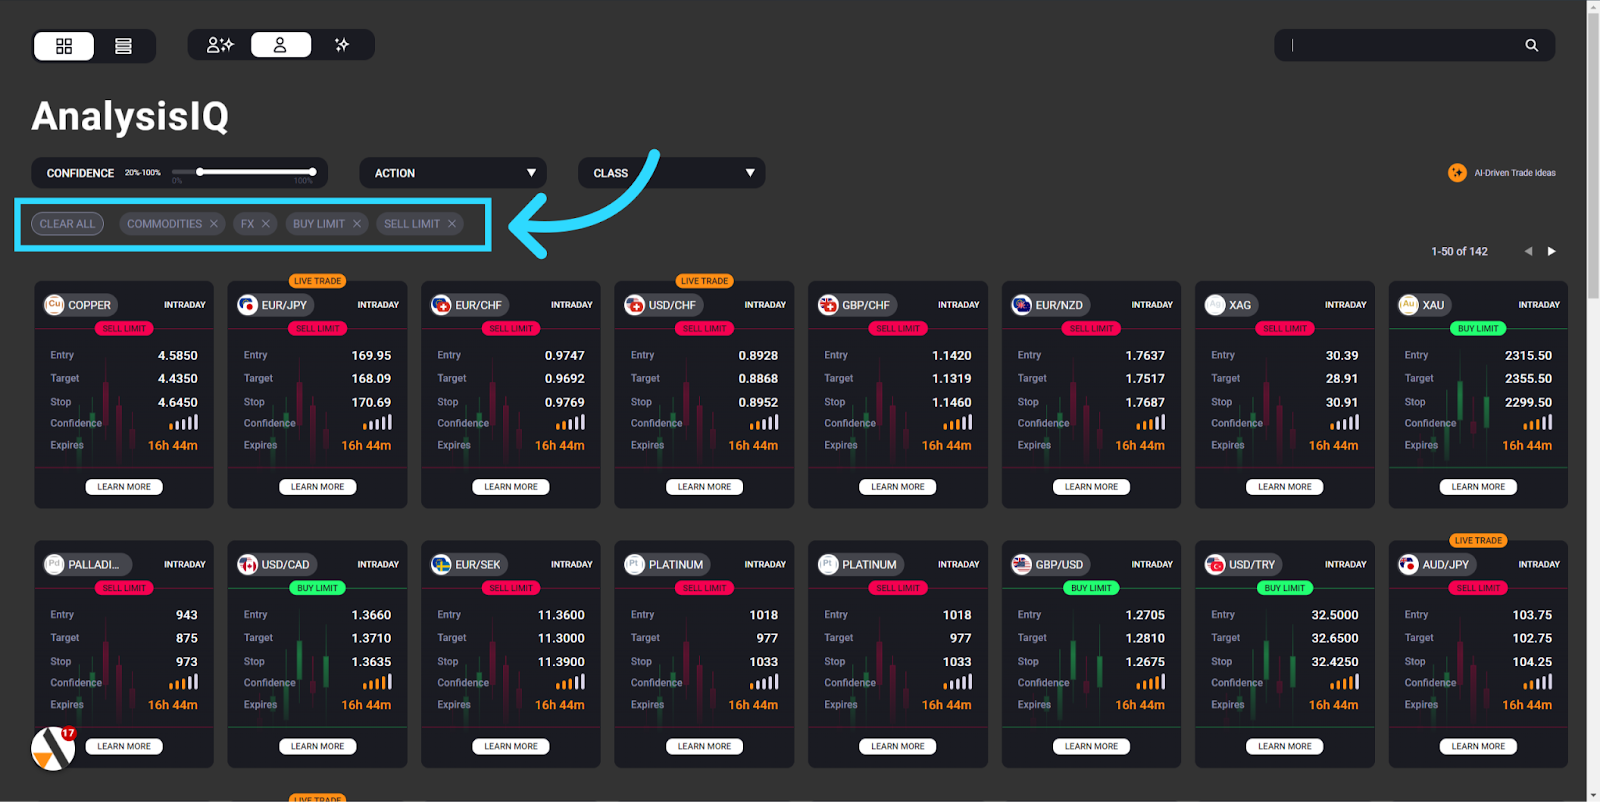
Filters
The selected filters will be displayed here.
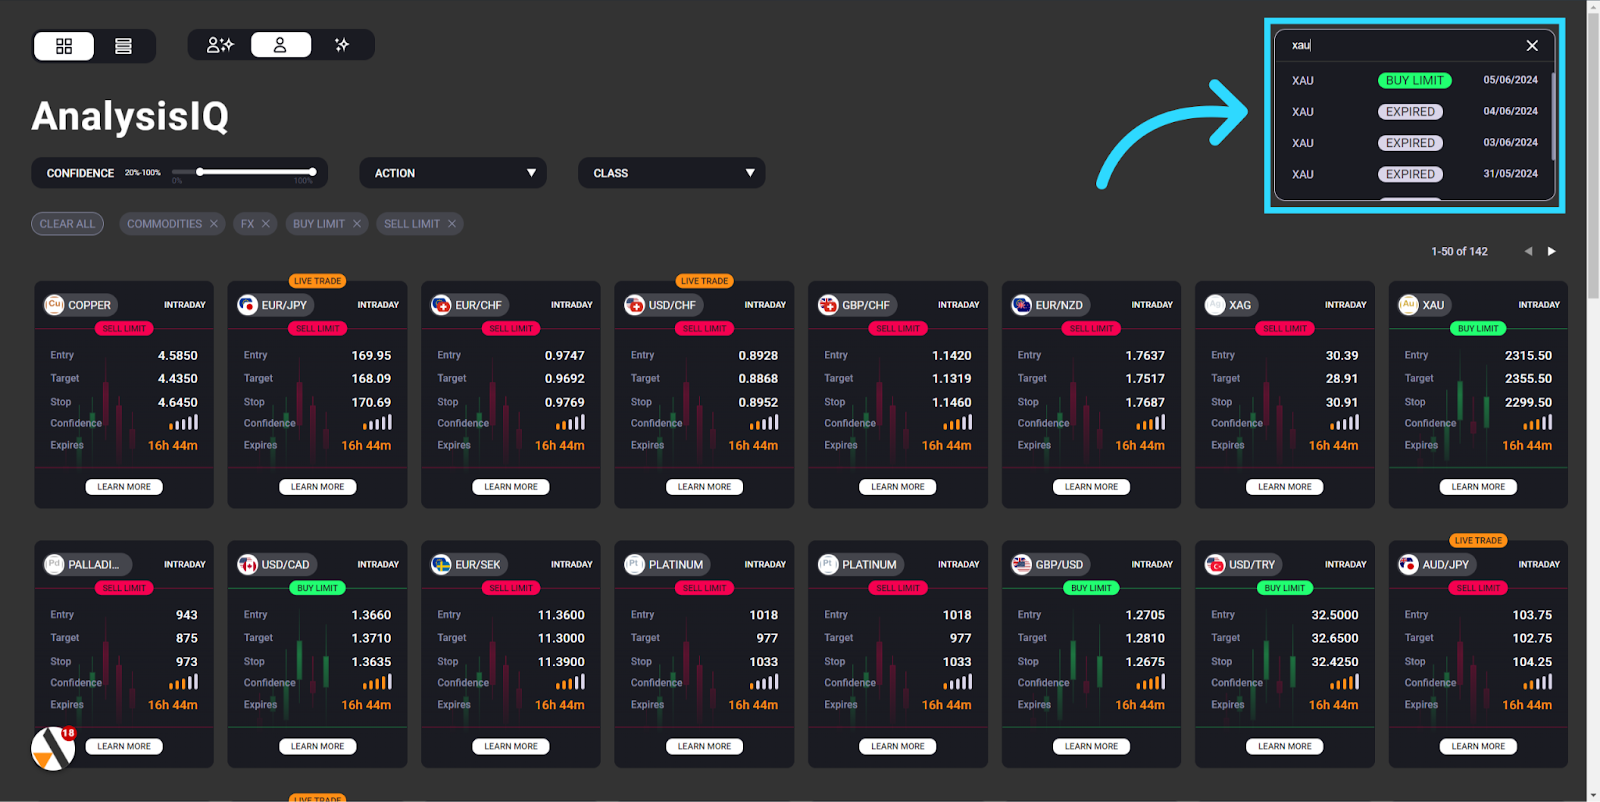
Search
Use the search function to find analysis on your favourite markets and specific instruments.
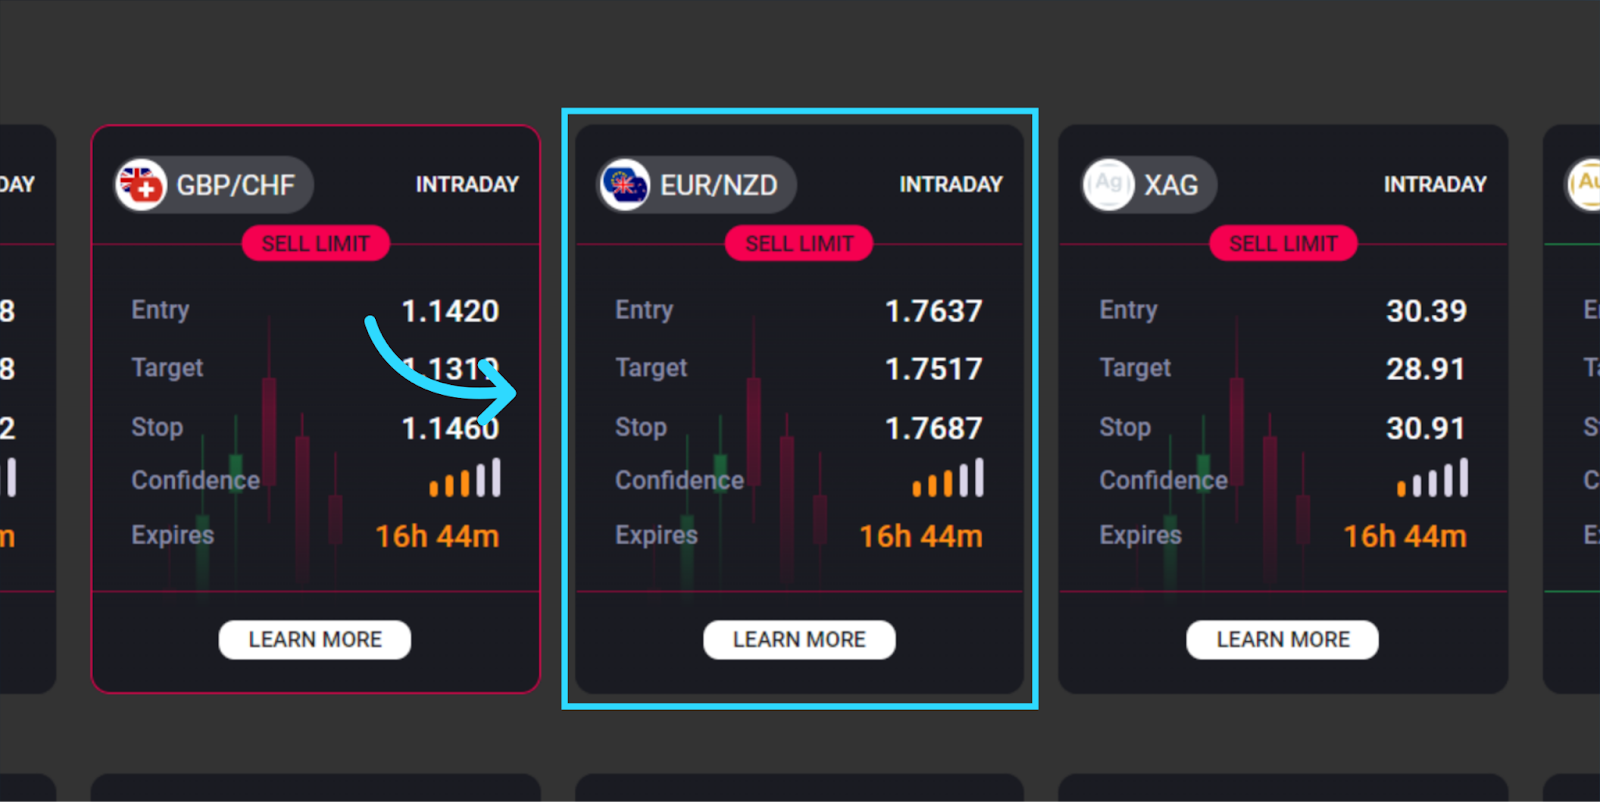
Tab
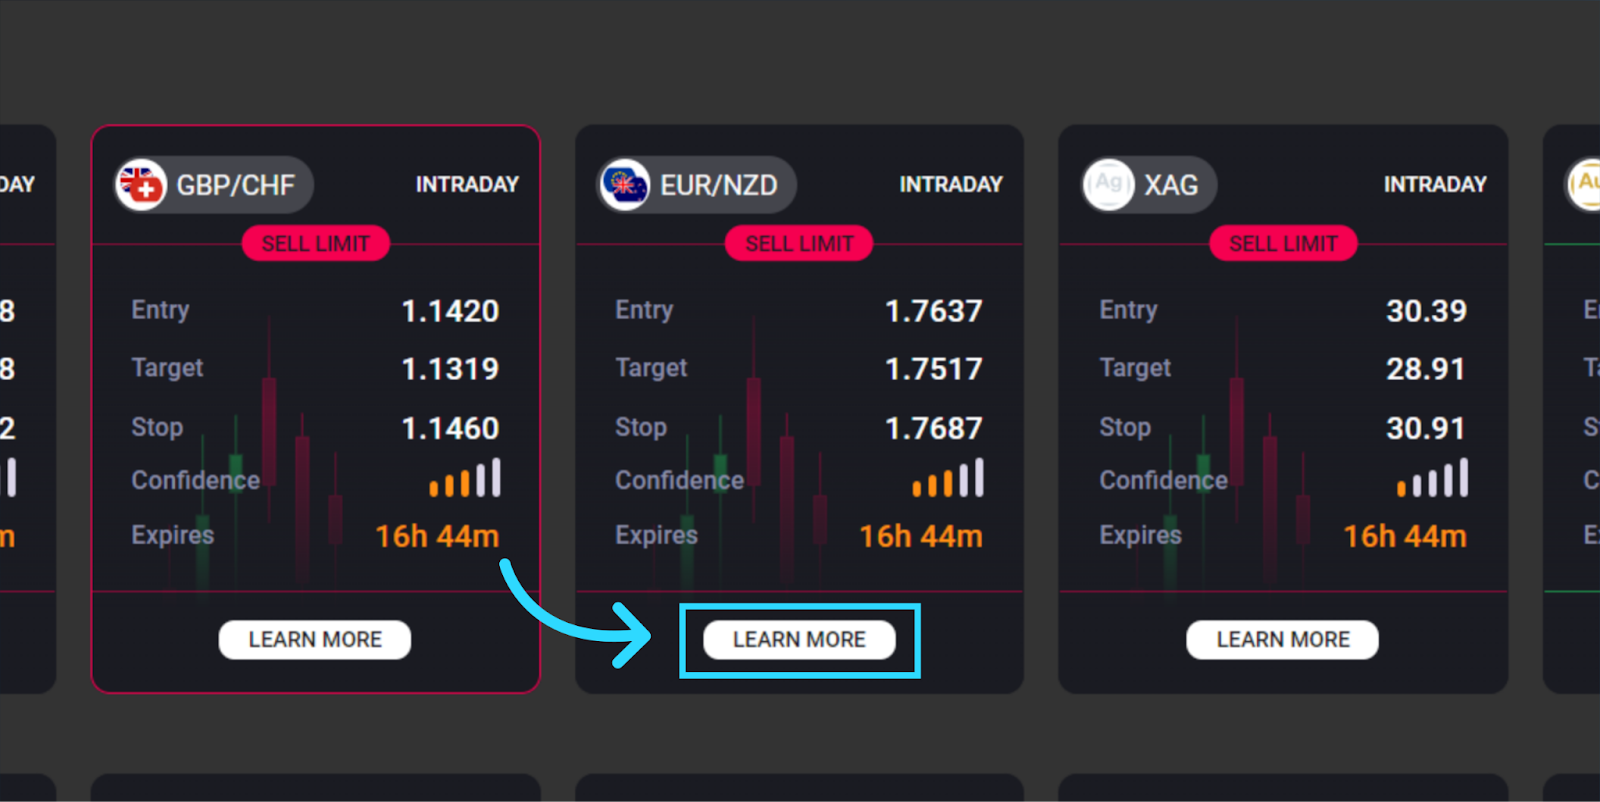
Each trade idea on the homepage provides key details to help you time your entry and exit. You'll see the asset, duration, order type, entry, target, stop, confidence, and time to expiry.
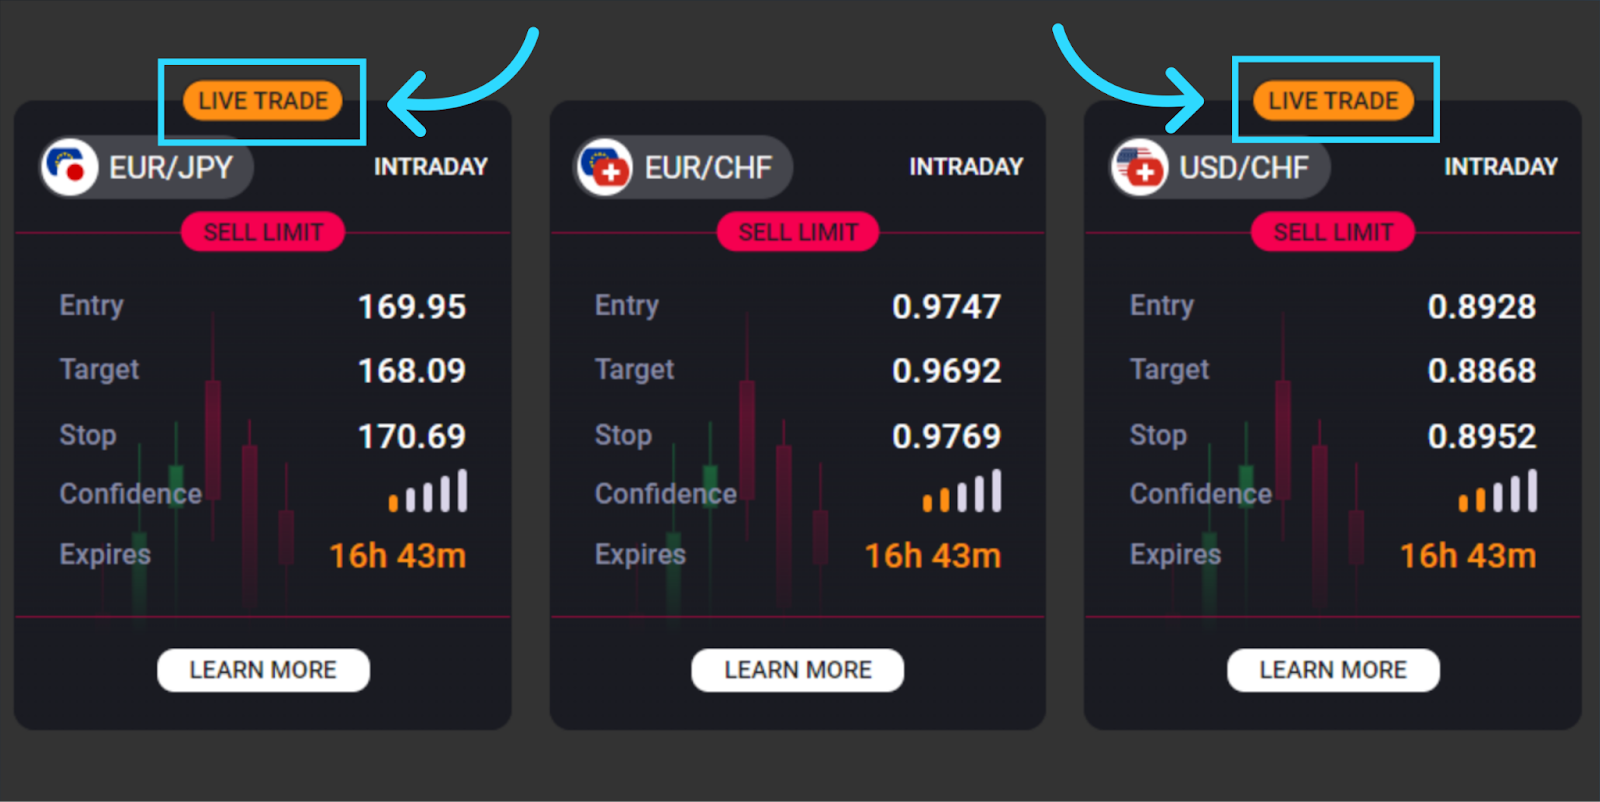
Trade status
The trade status updates throughout the trading day, showing one of the following: 'Live Trade' indicates the trade idea has reached its entry level. 'Closed - Profit' means the trade idea has hit its target. 'Closed - Loss' signifies the trade idea has reached the stop level.
Learn More
Clicking the 'Learn more' button gives you access to detailed trade setups and visualizes the opportunity on a price chart. This button can also be customized to allow direct trading from the dashboard when linked to Metatrader and other platforms.
Call to action
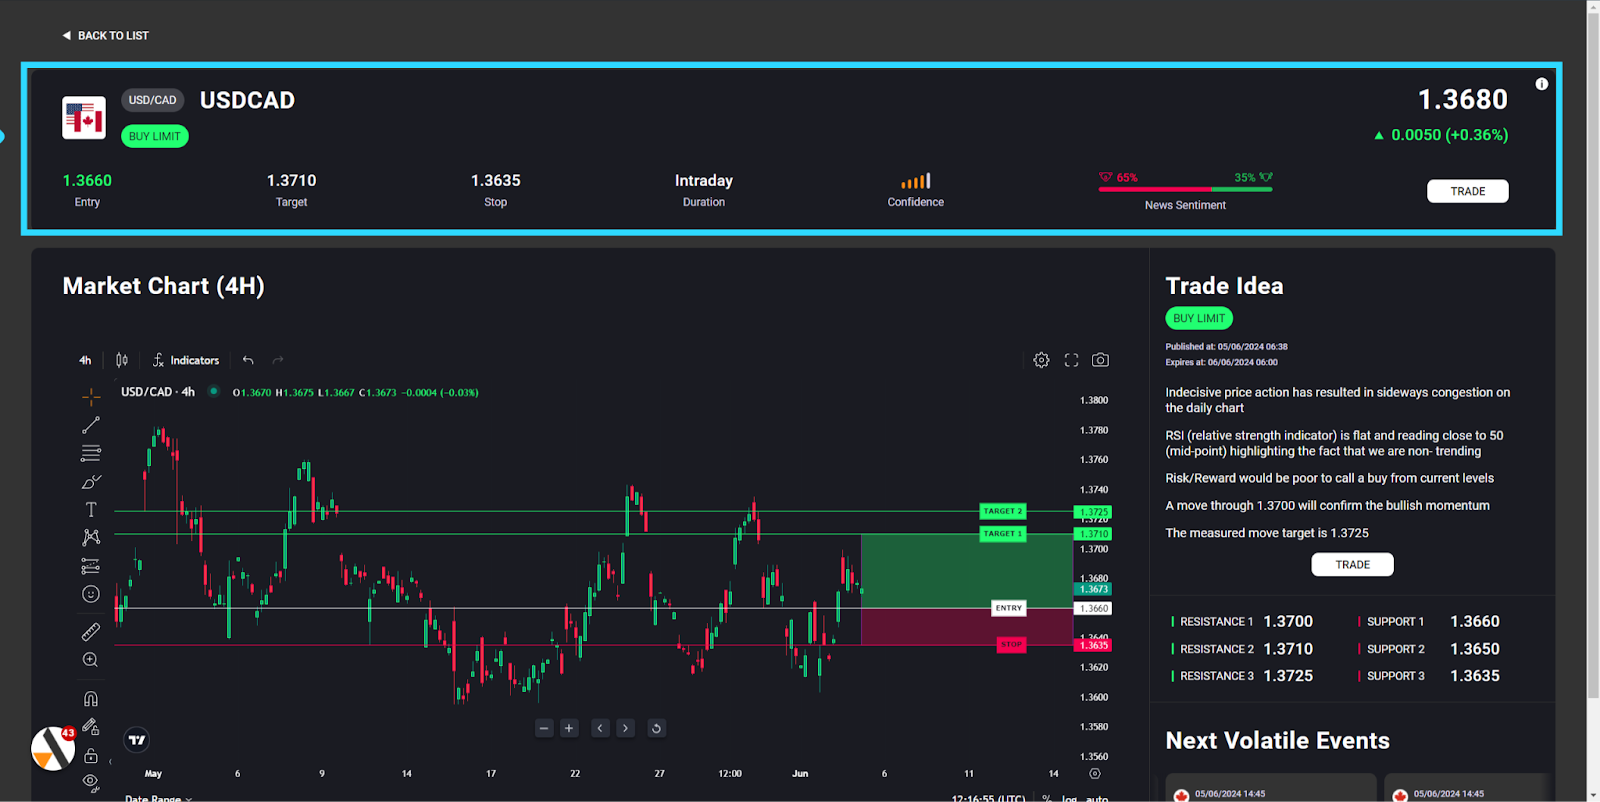
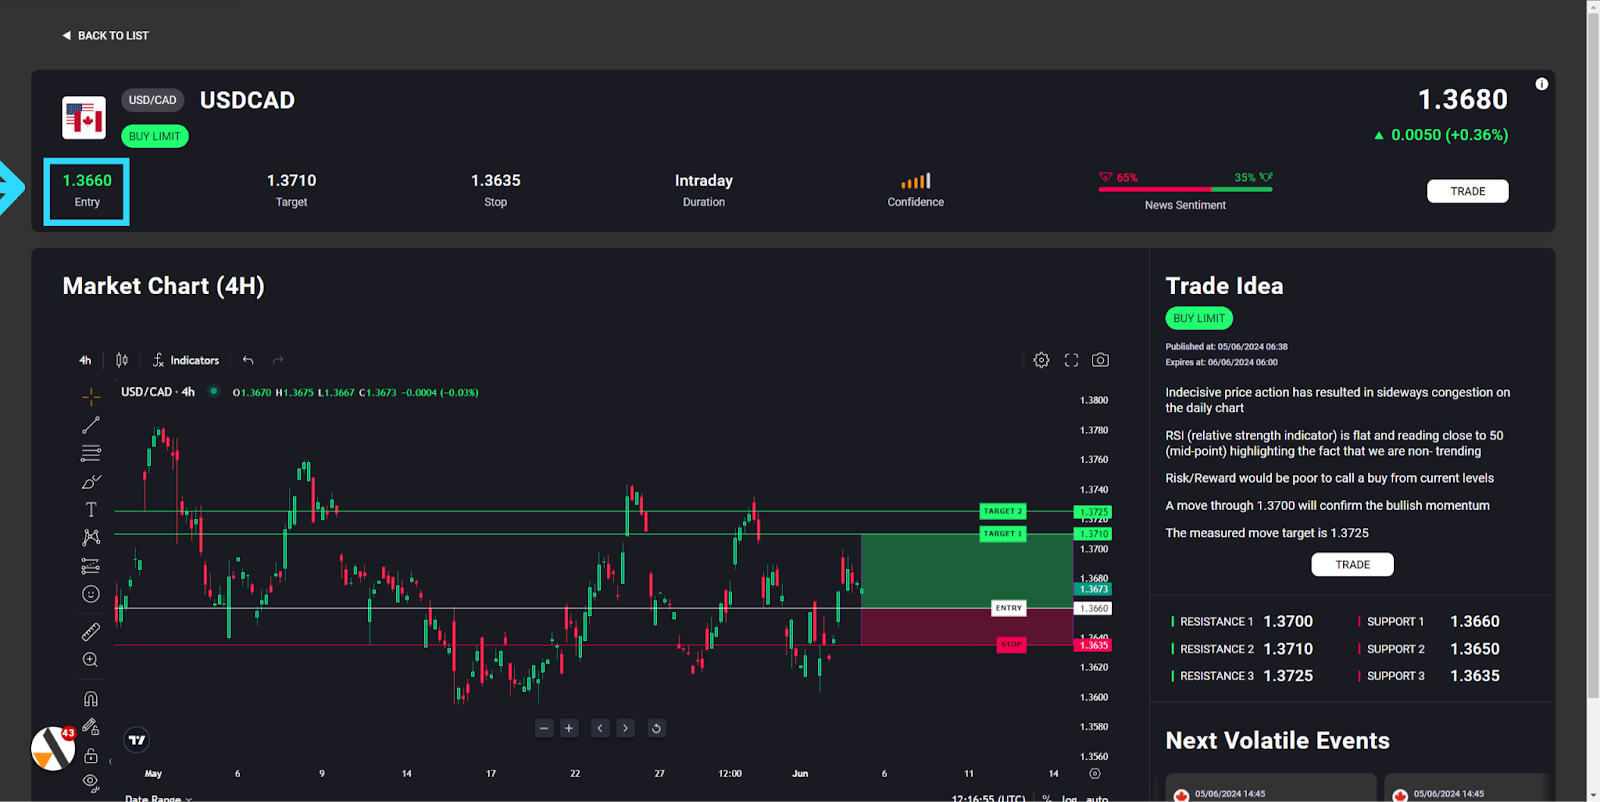
Use the key levels to grasp the parameters of the trade idea: where our analysts plan to enter, their target, and the stop loss placement. The trade idea status updates throughout the day, reflecting progress based on these target levels.
Entry
If the trade idea meets the entry level, the status will change to ‘Live Trade'.
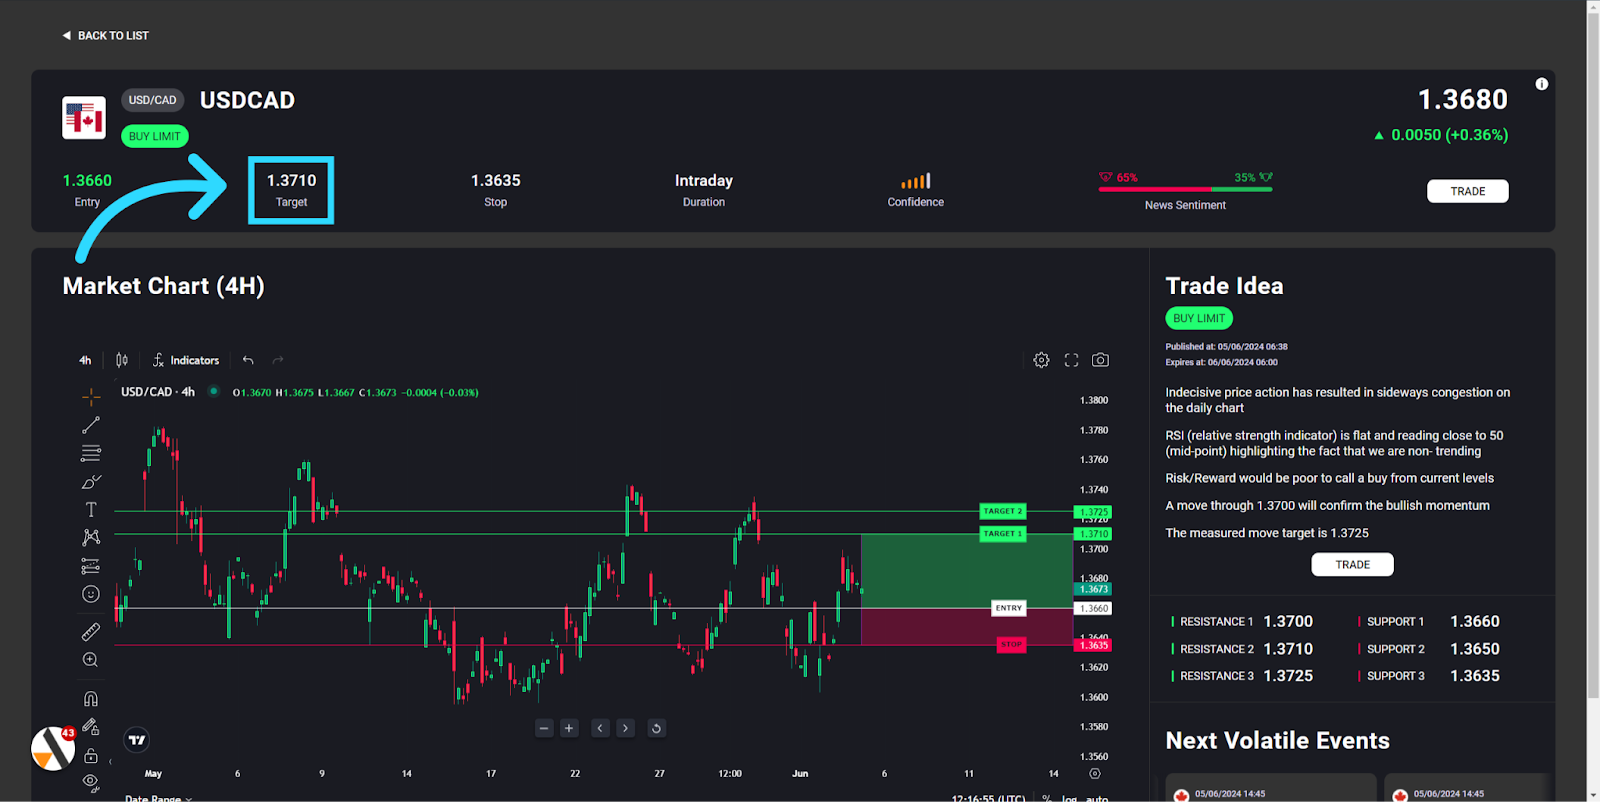
Target
If the trade goes live and the price reaches the 'Target', the status will be updated to 'Closed - Profit'.
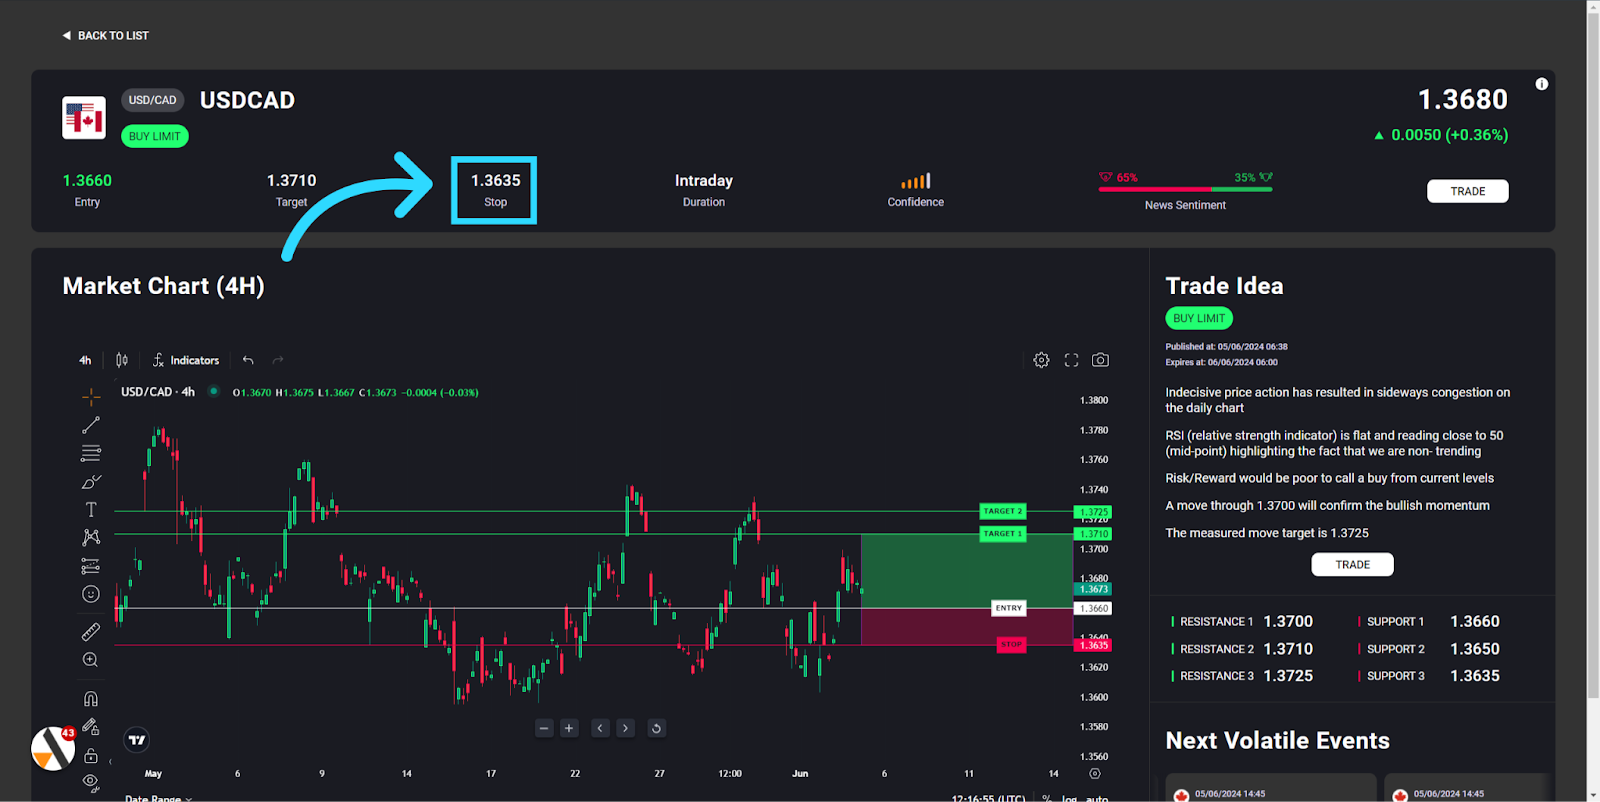
Stop
If the trade goes live but the price hits the 'stop', the trade will close and the status will be updated to ‘Closed - Loss’.
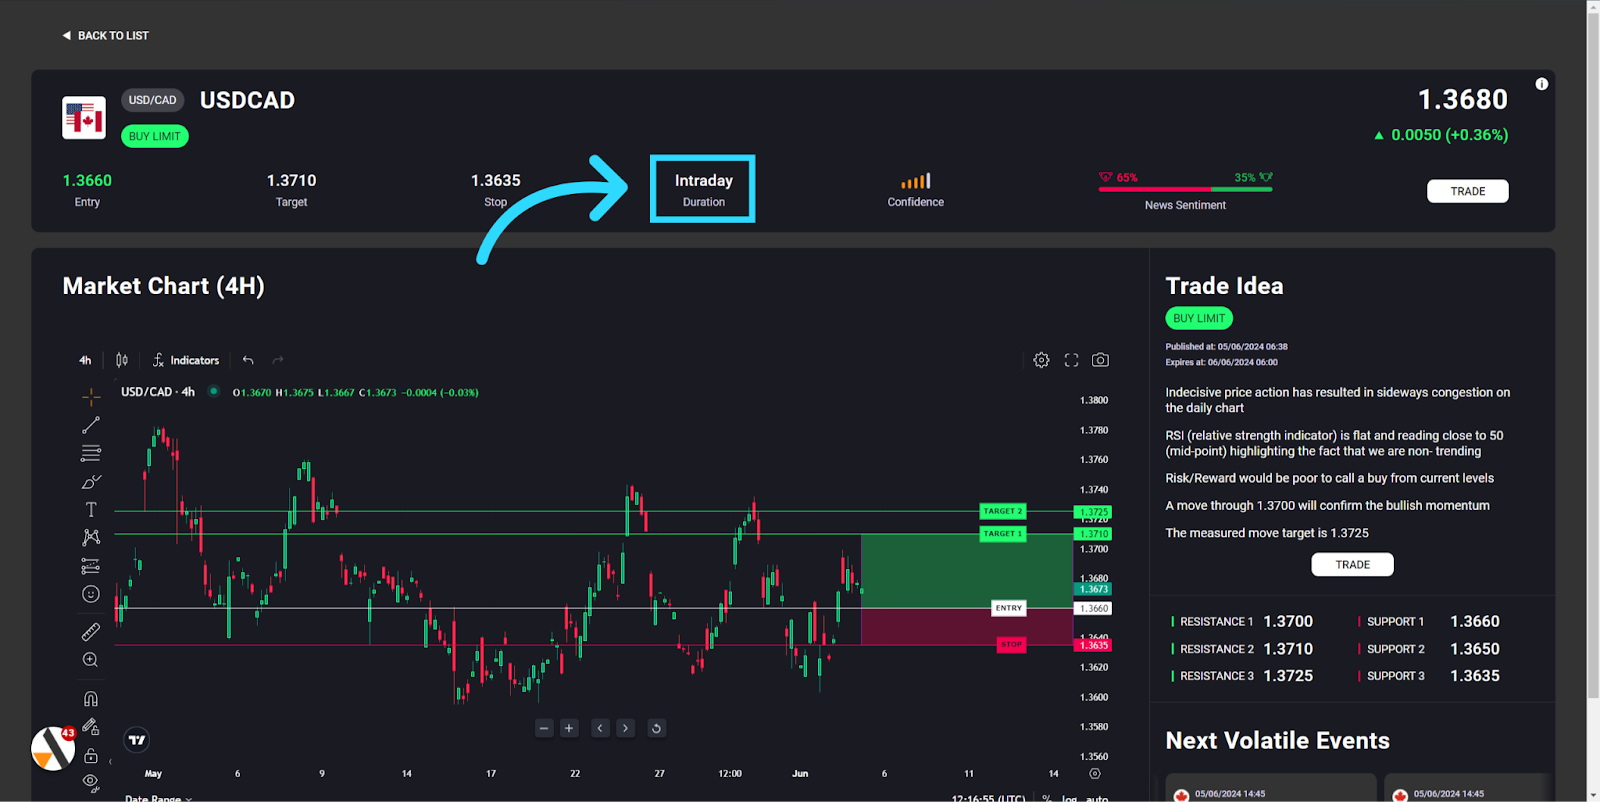
Duration
The duration will define if the trade idea is either 'Intraday' meaning the setup will expire within 1 trading day or 'Short term' meaning the setup will expire between 1-4 weeks.
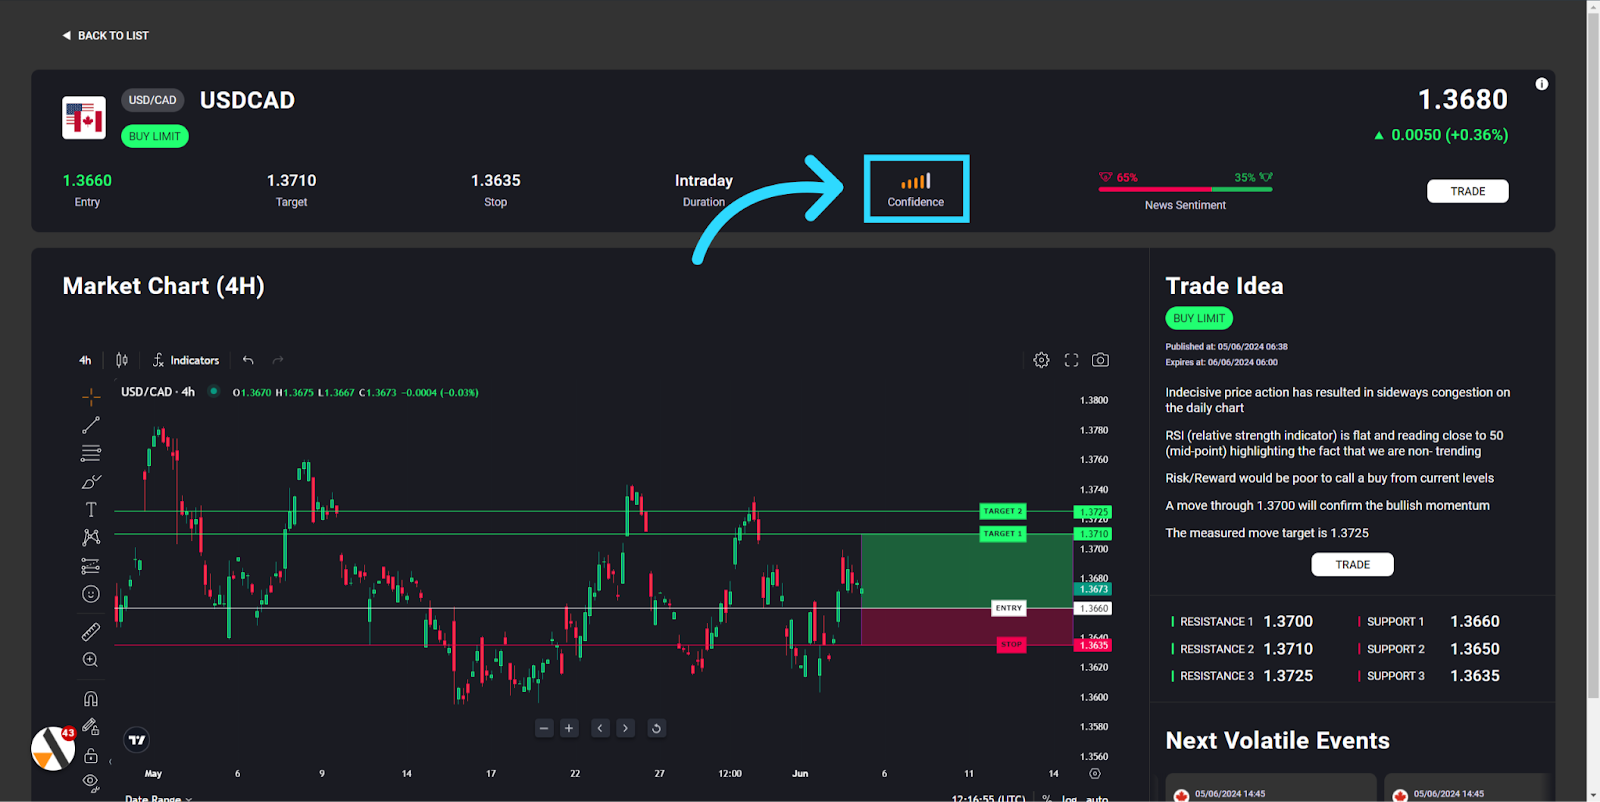
Confidence
The confidence score is calculated using a proprietary formula based on multiple criteria.
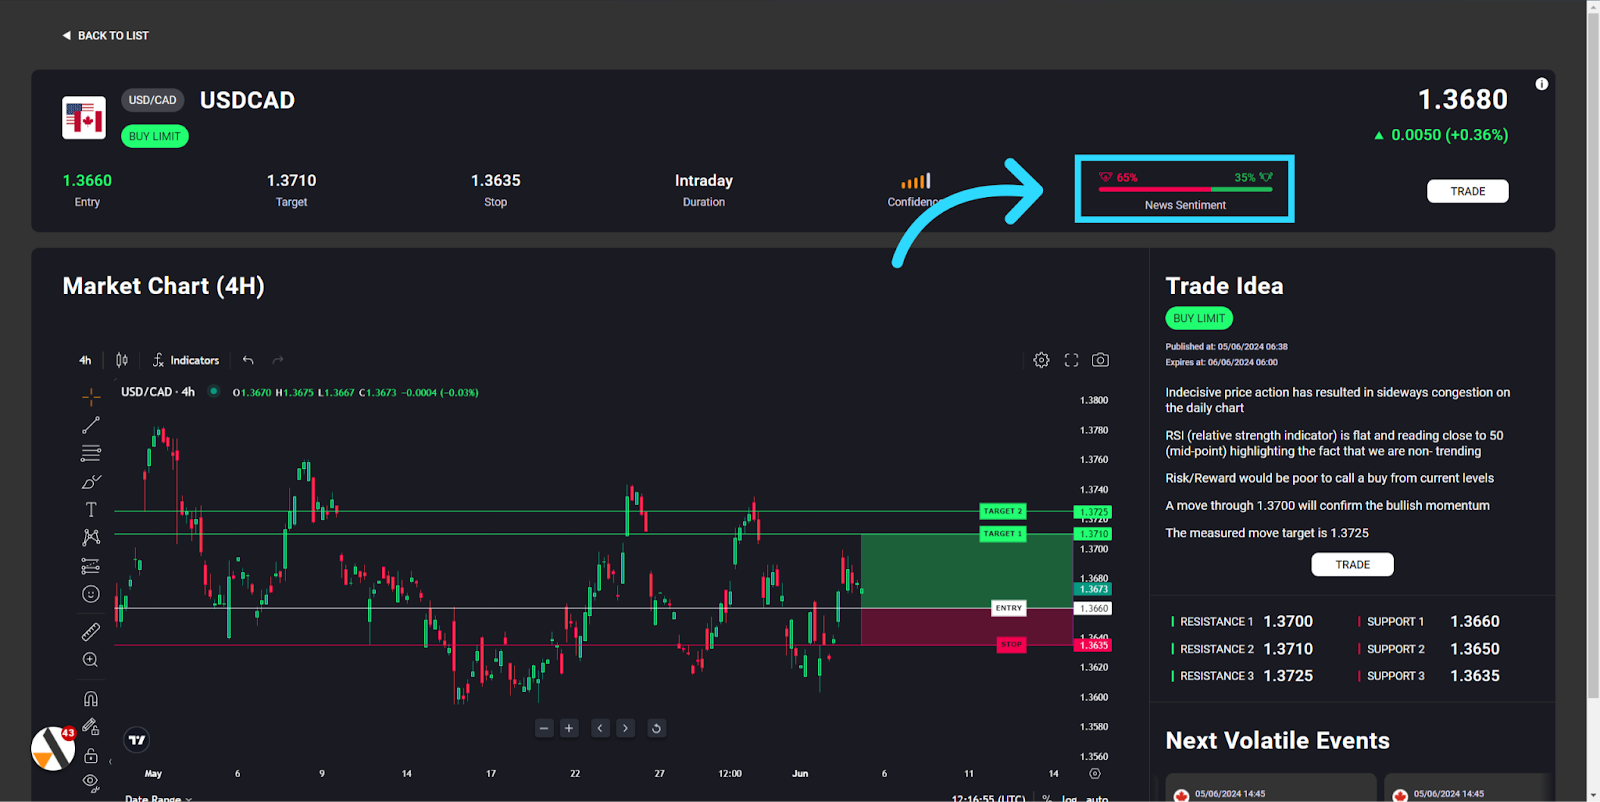
News Sentiment
The news sentiment gauge displays how the global investment community currently feels about the asset. It is measured by analysing millions of news articles every day using AI technology.
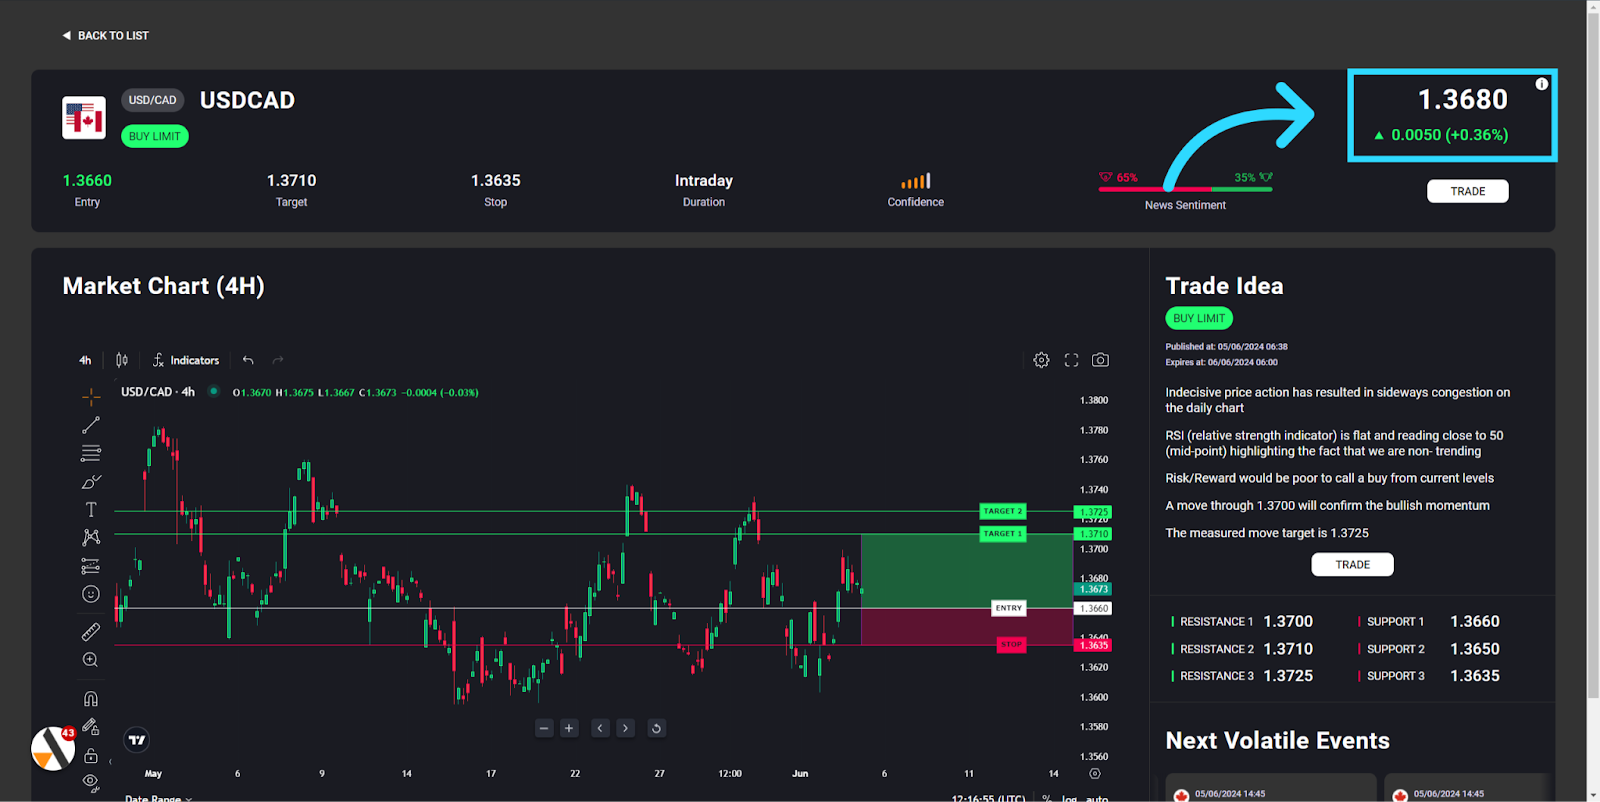
Live price
This section shows the latest price and price change relevant to the trade ideas.
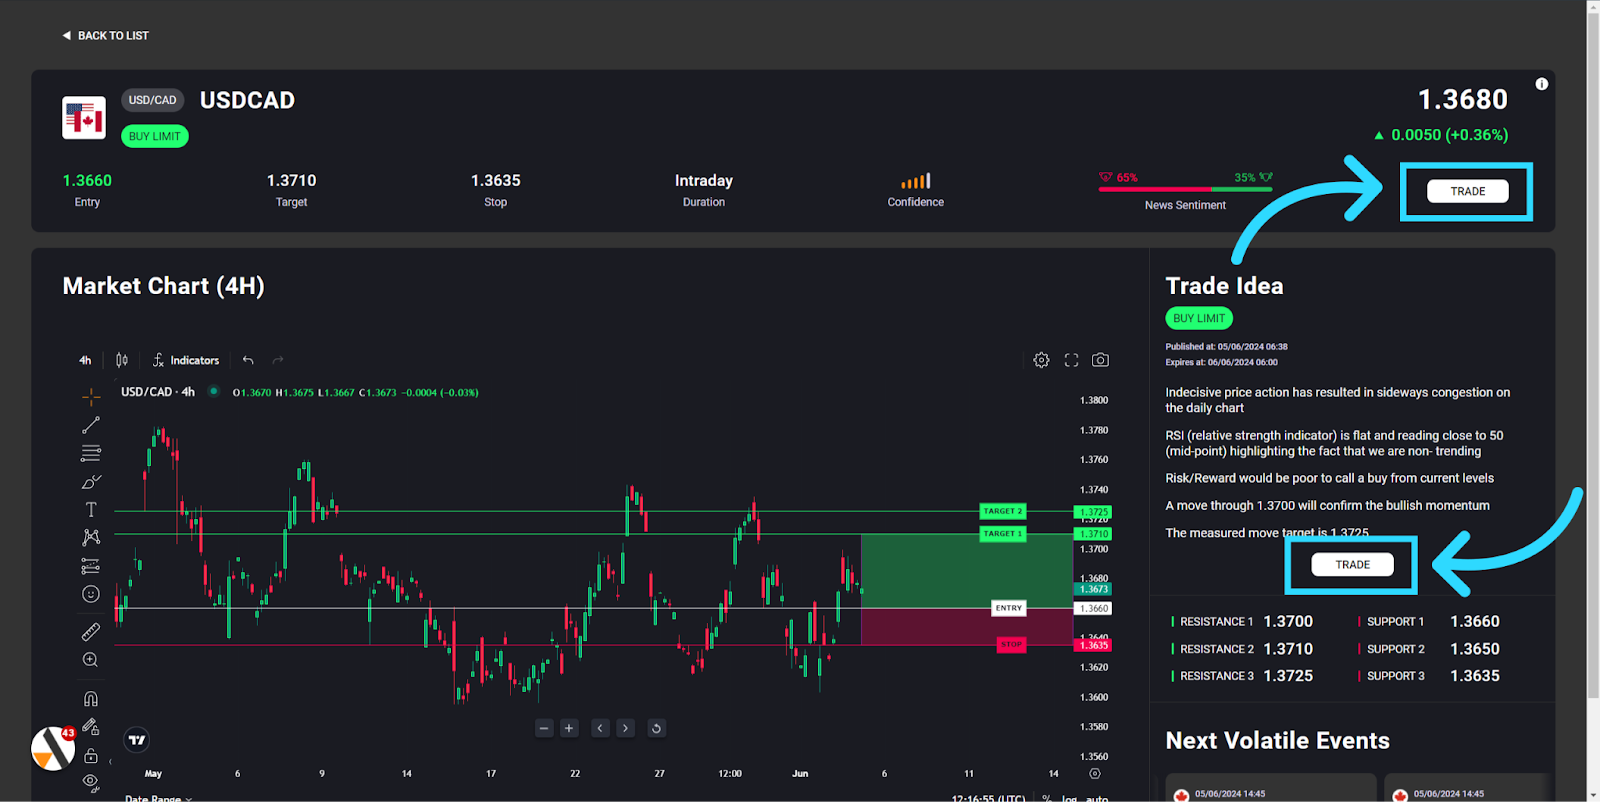
Trade
Conveniently located 'Trade' buttons enable traders to execute the trade setups directly from the dashboard when connected to MetaTrader and other trading platforms.
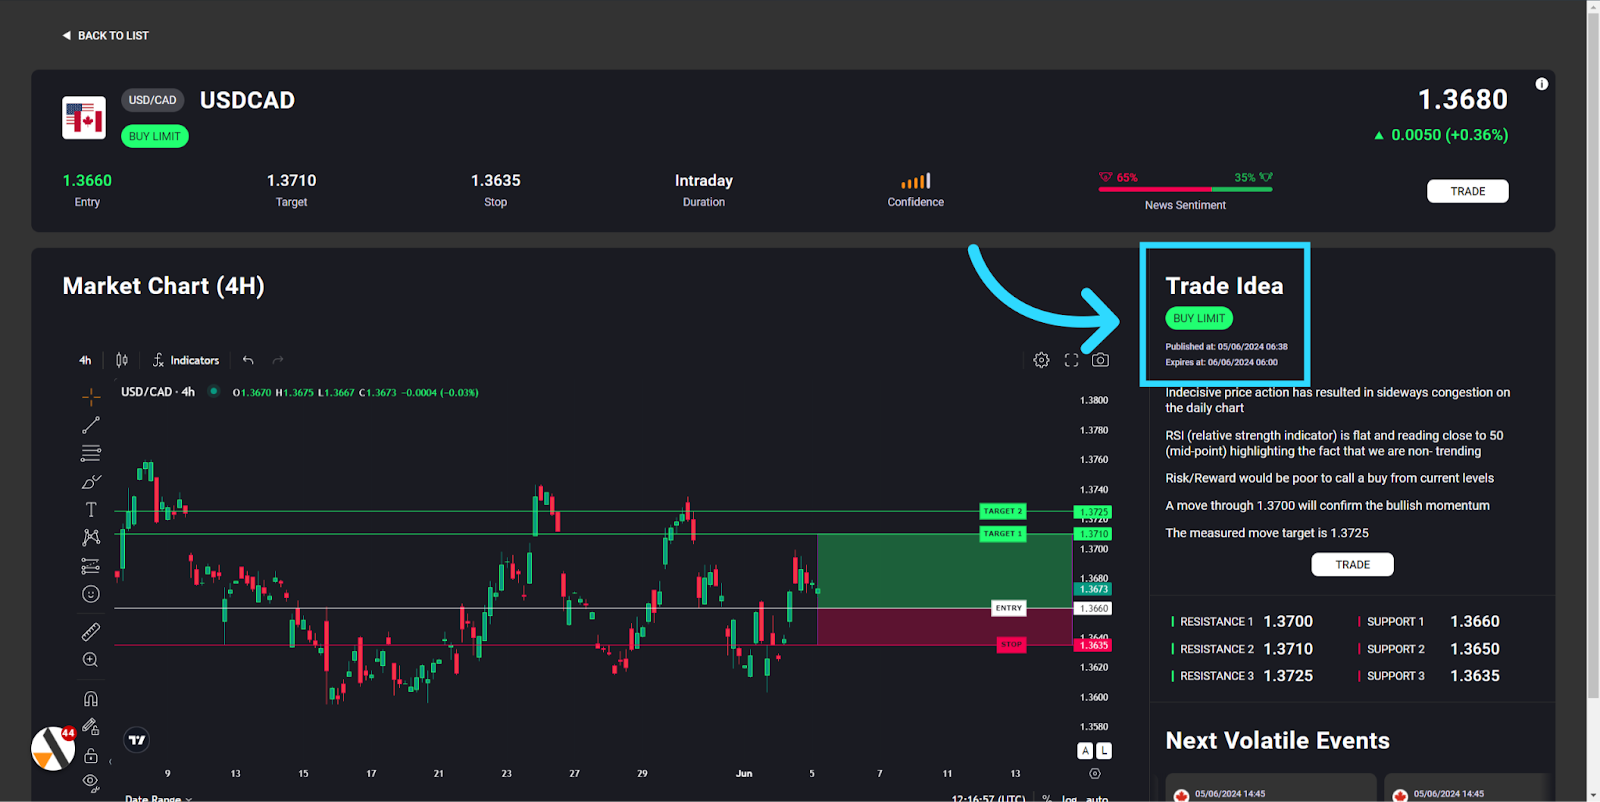
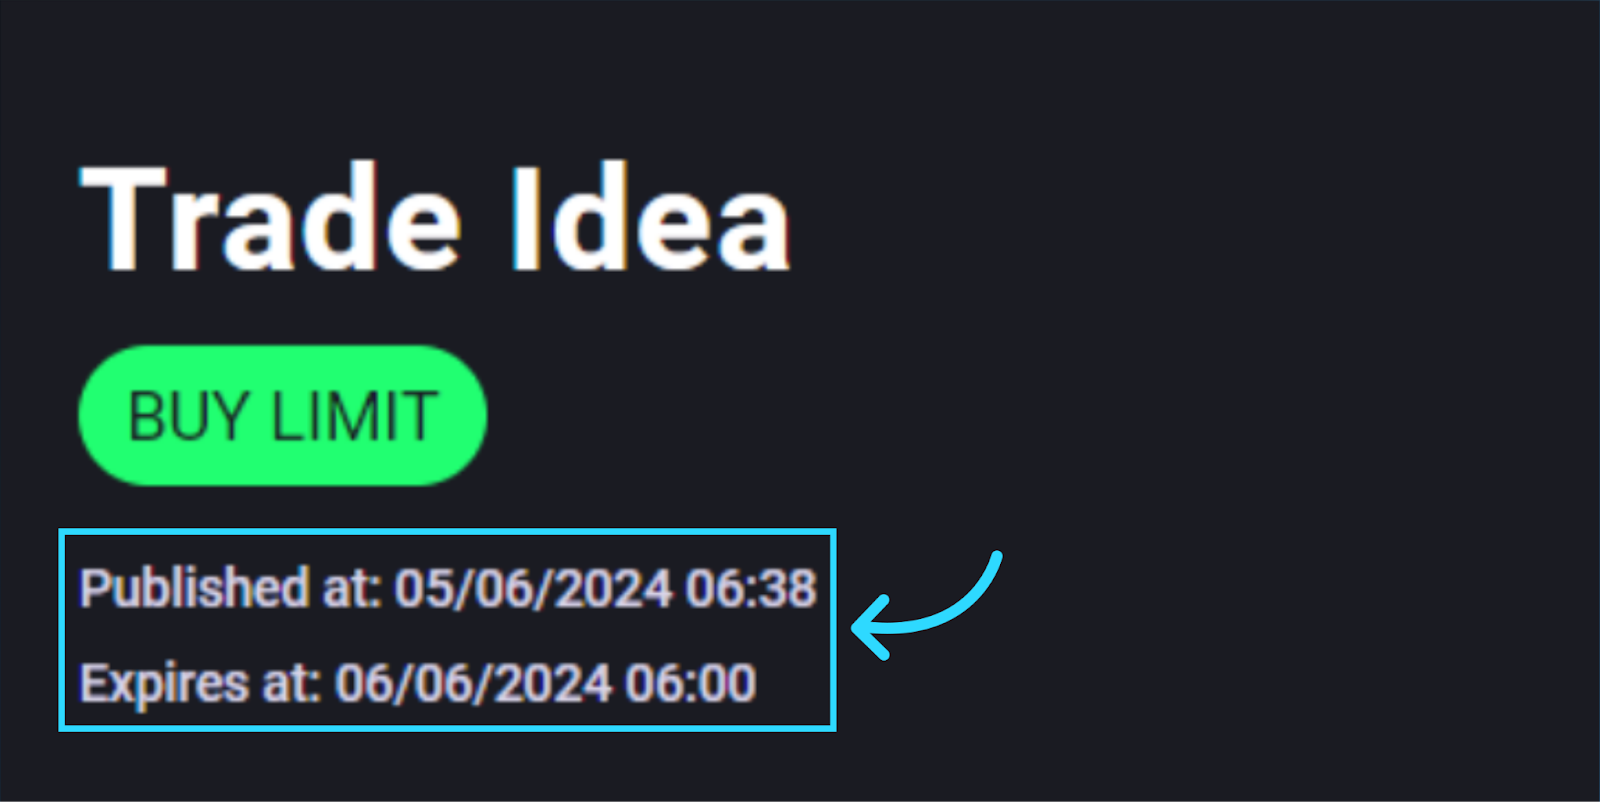
Trade idea
Each trade idea is time stamped when published.
Timestamps
Trade ideas will remain live for approximately 23 hours from the time they are published, with the exception of stock analysis. Stock analysis features extended expiry times, ranging from 1 day to 4 weeks.
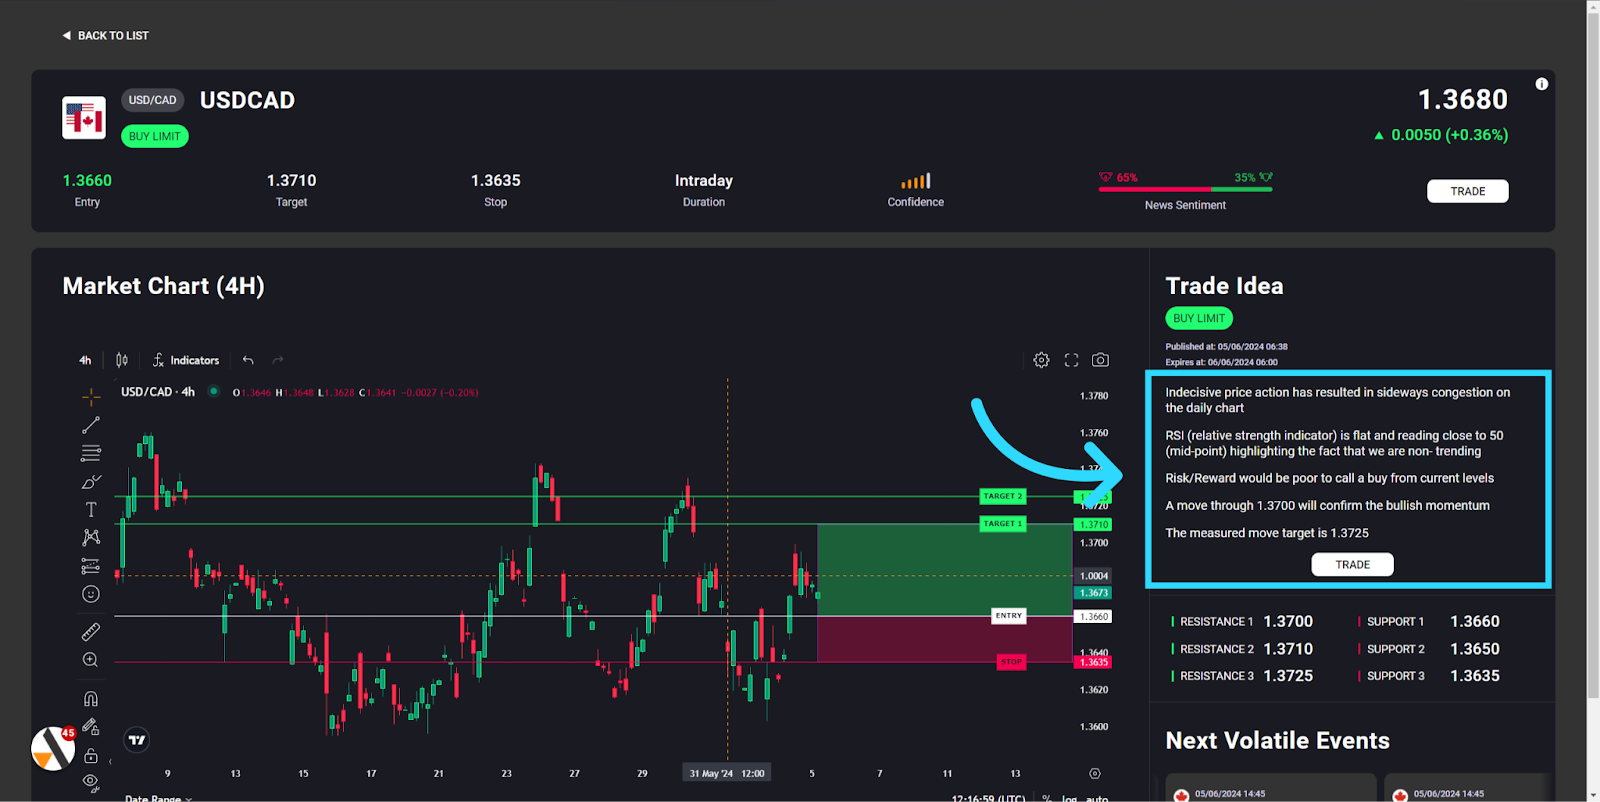
Description
Every trade idea is accompanied by an explanation of why we believe it's a good opportunity. These insights are designed to assist traders and enhance their financial literacy and decision-making skills.
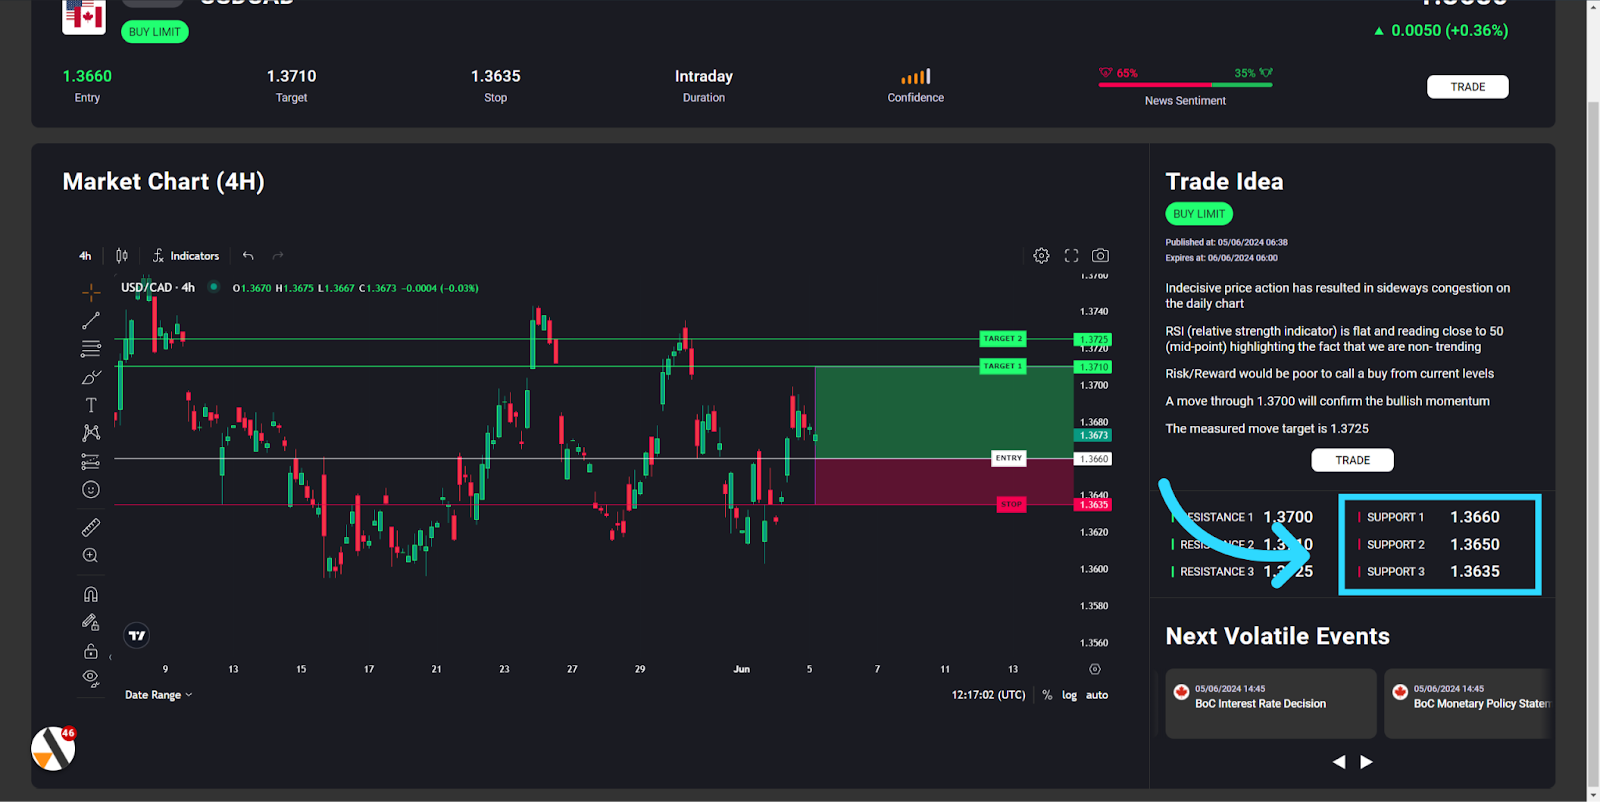
Resistance
Support and resistance levels are provided for all assets we cover. These are the key levels considered significant for each asset.
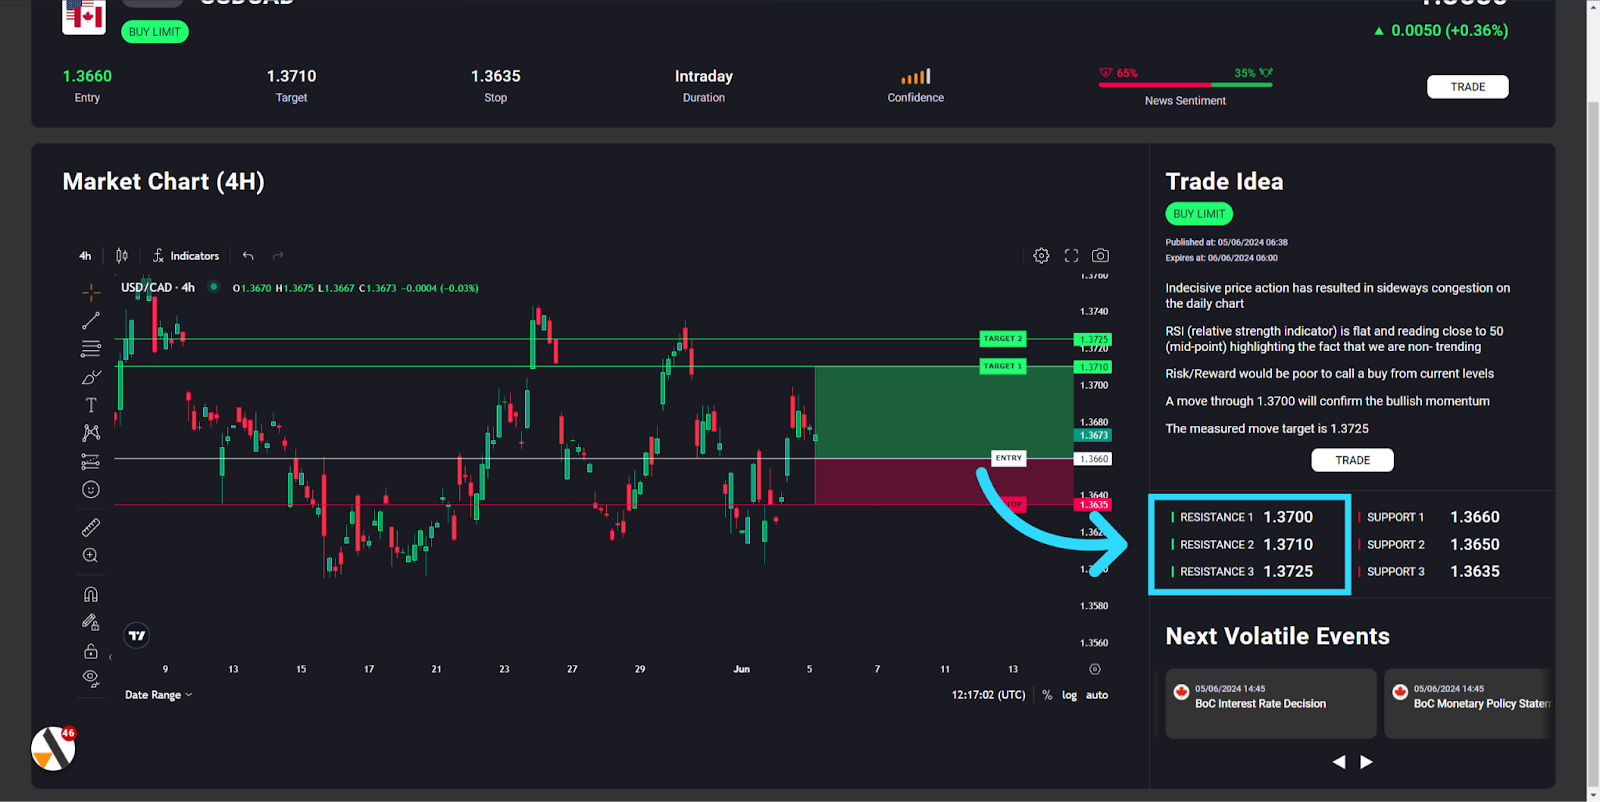
Support
These levels could be a trend line, Ichimoku Cloud levels, or even a Fibonacci level. They indicate potential points where buyers and sellers might emerge, both on the downside and the upside. Traders can leverage these levels to validate their own trade setups or create alternative trade setups, using our analysis as a foundation for their trades.
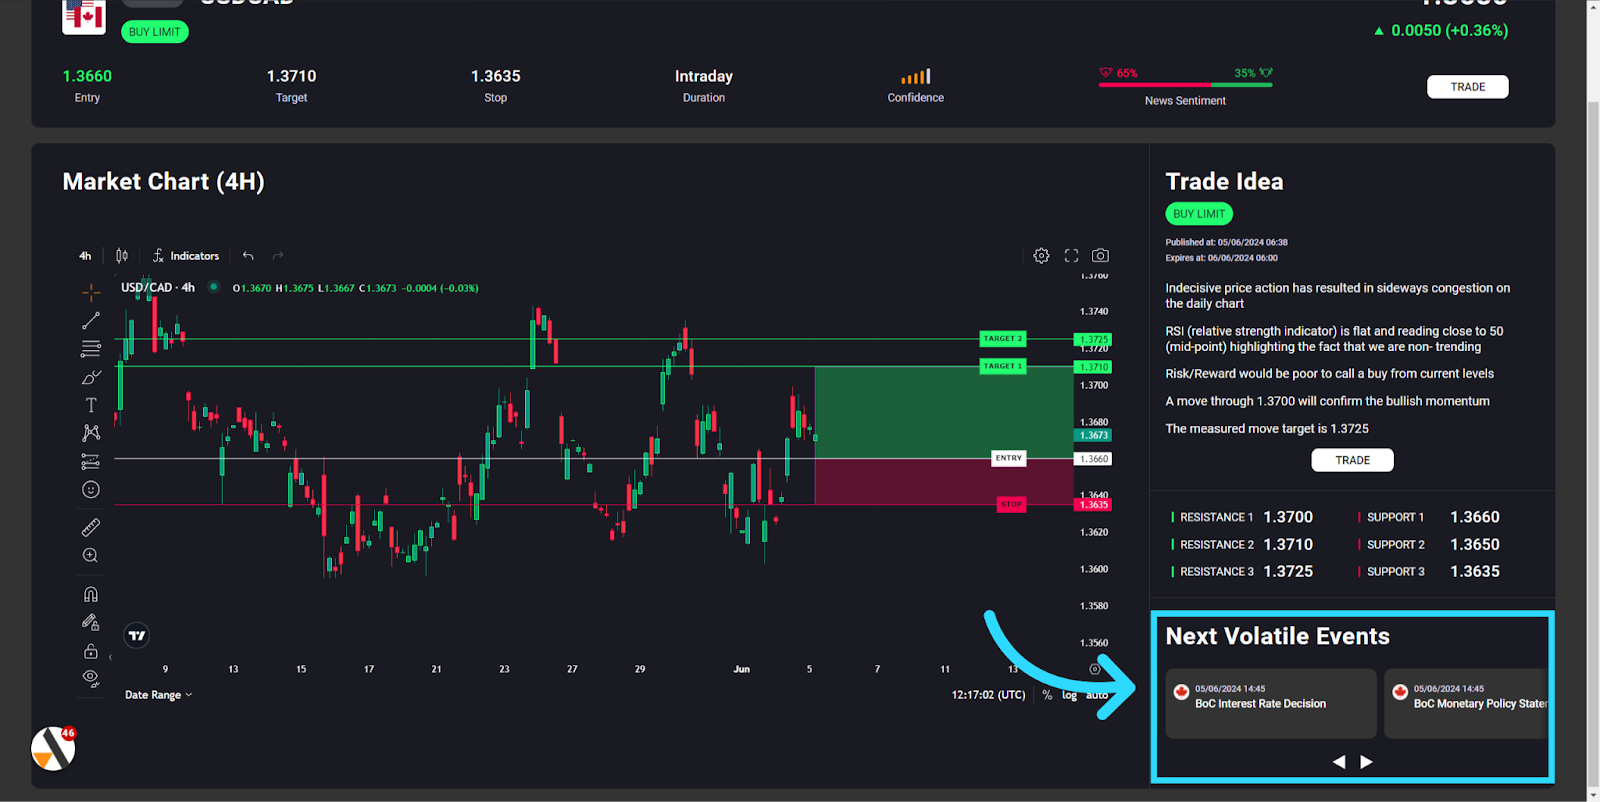
Next Volatile Events
The "Next Volatility Events" section showcases upcoming events within the trade timeframe that could significantly impact market activity. Our analysts diligently monitor data from these events and promptly update the signal as needed.
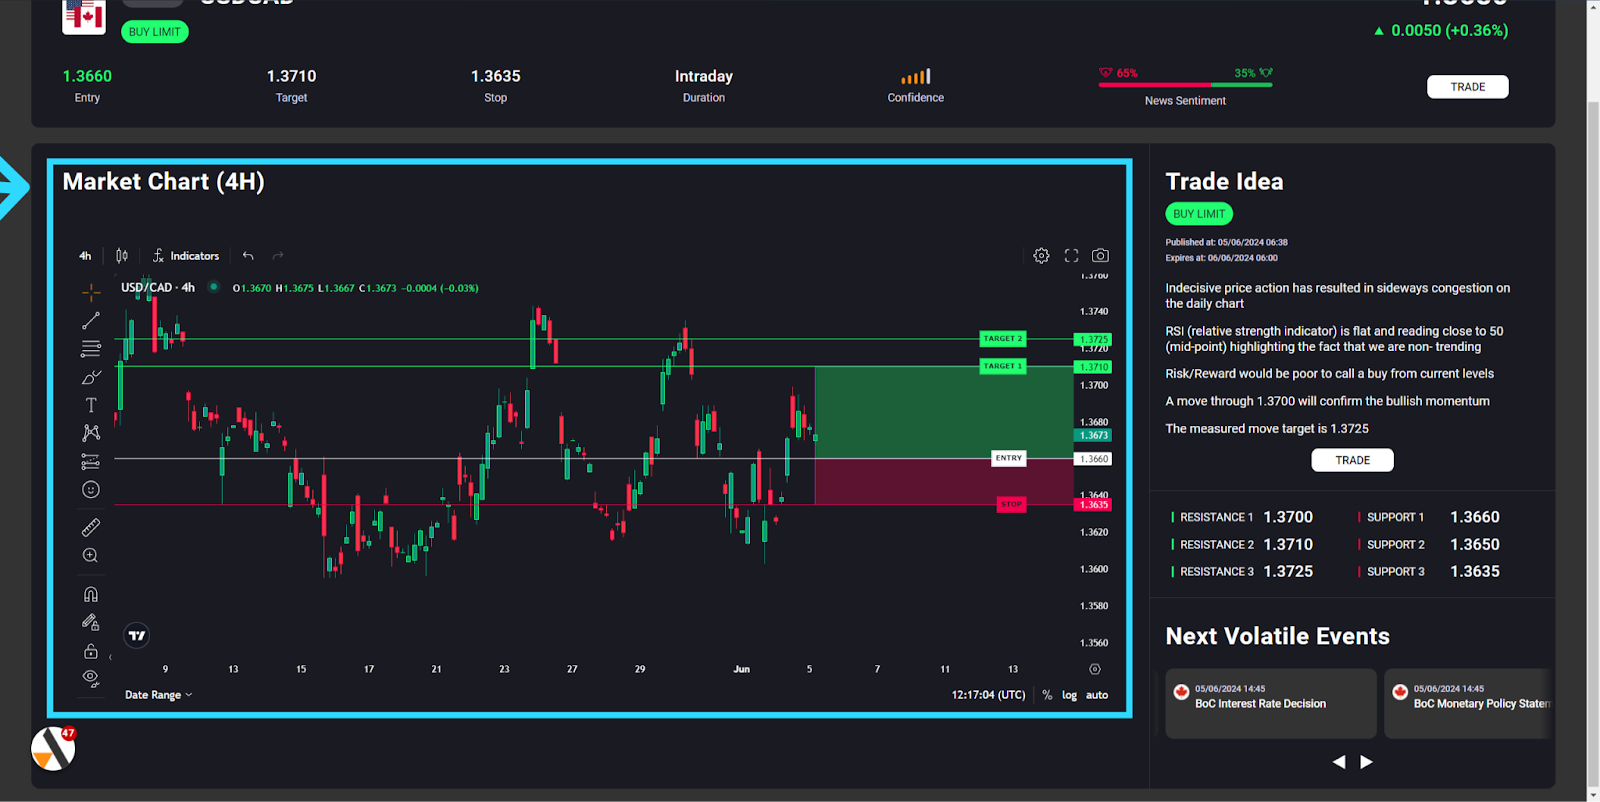
Chart
The chart presents real-time price data alongside the past 7 days' information. Each candle symbolizes 4 hours of price movement. The red and green scale on the right-hand axis visually illustrates potential gains and losses of the signal. Utilize these indicators to track price movements within the predefined key levels.
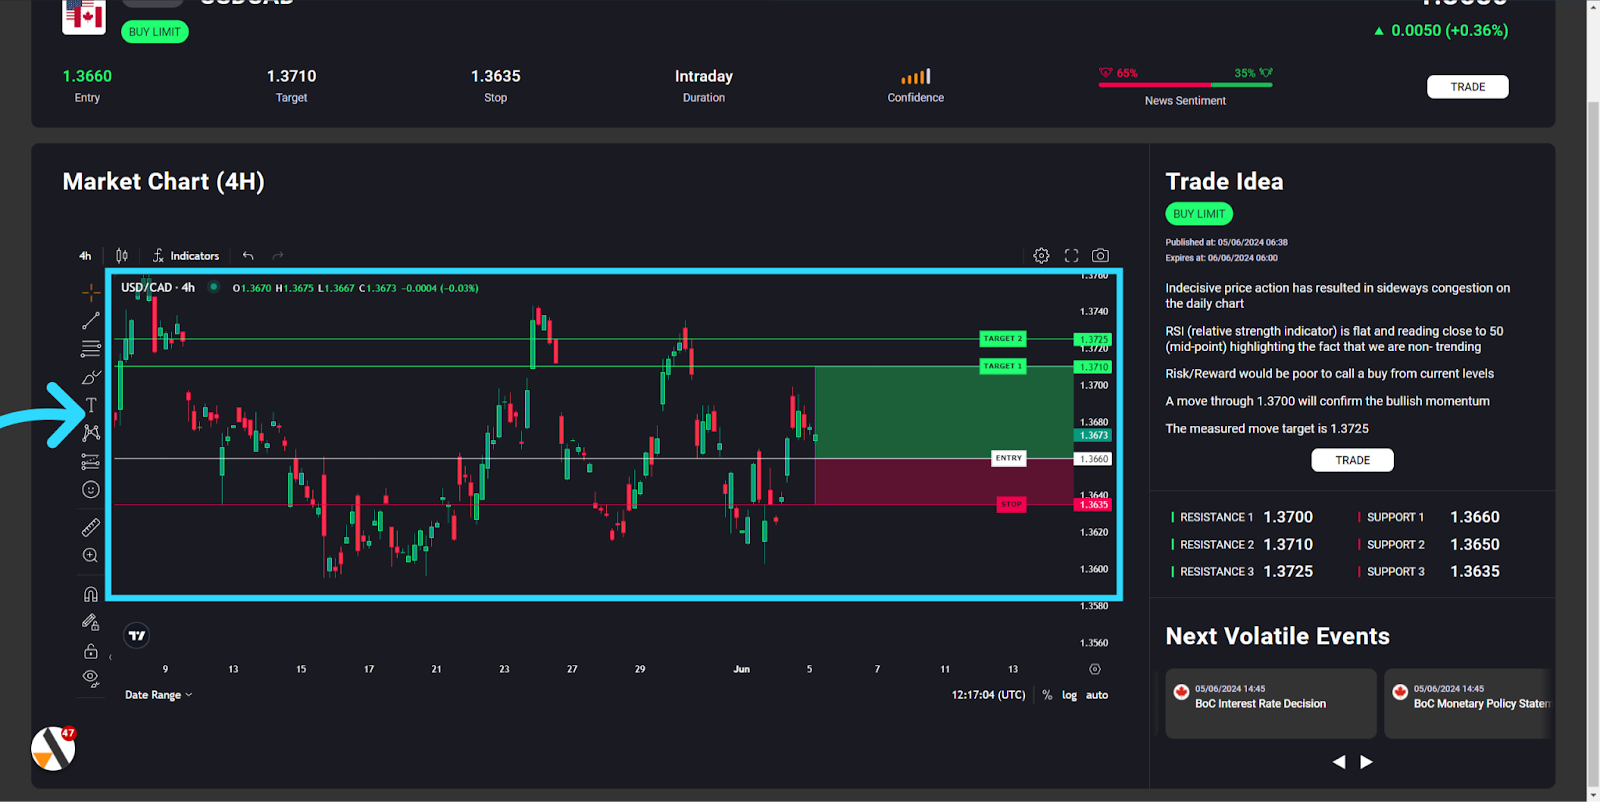
Trade levels
Visualise the entry, take profit and stop loss level on the price chart.
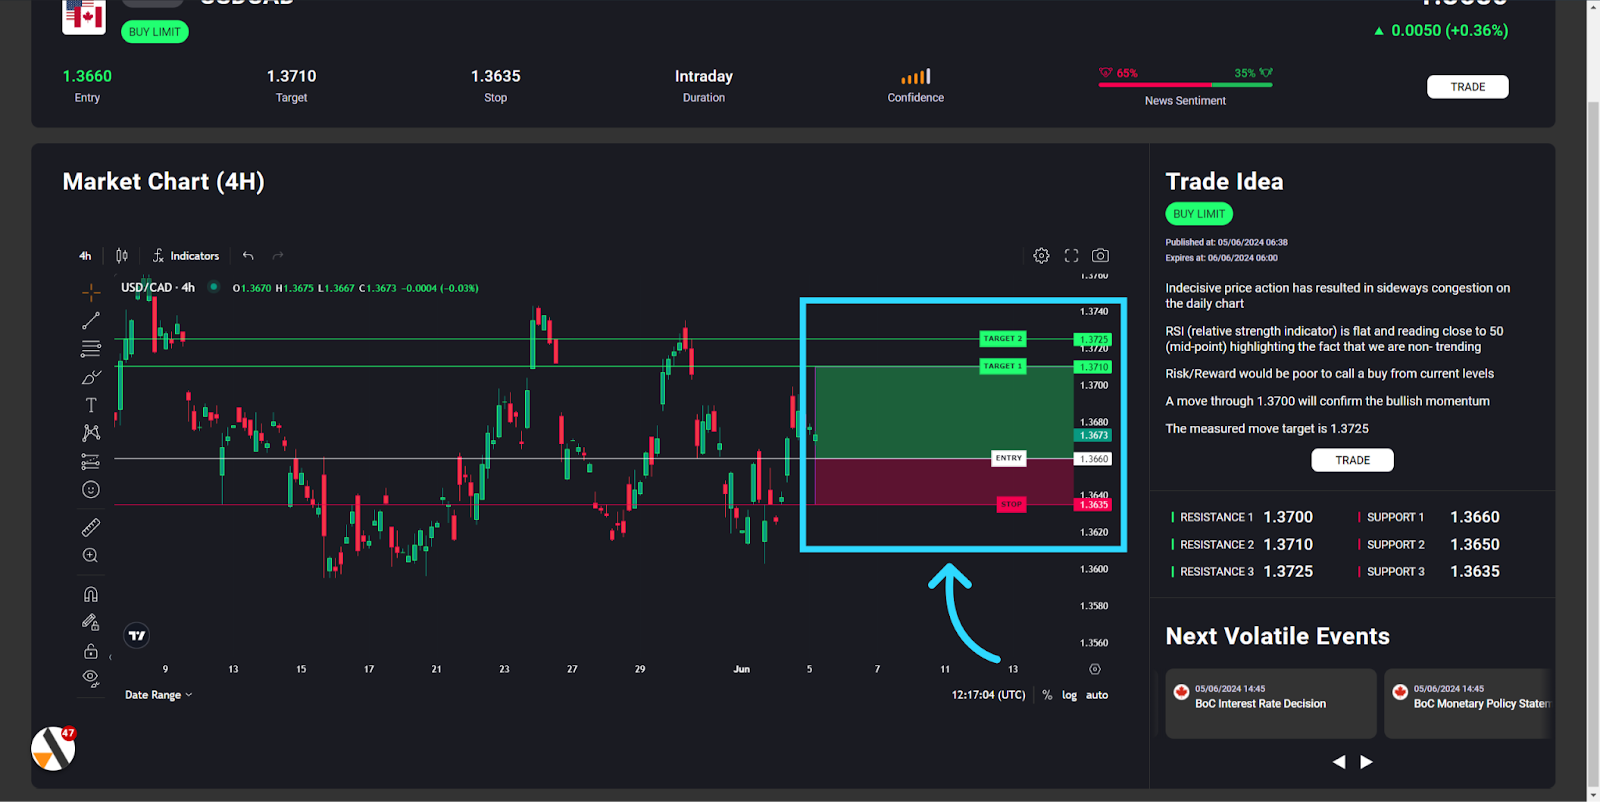
Risk/Reward
Each trade displays the risk and potential reward. All Trade Ideas published have a risk/reward ratio in excess of 2:1, sometimes this can be even as much as 5:1.
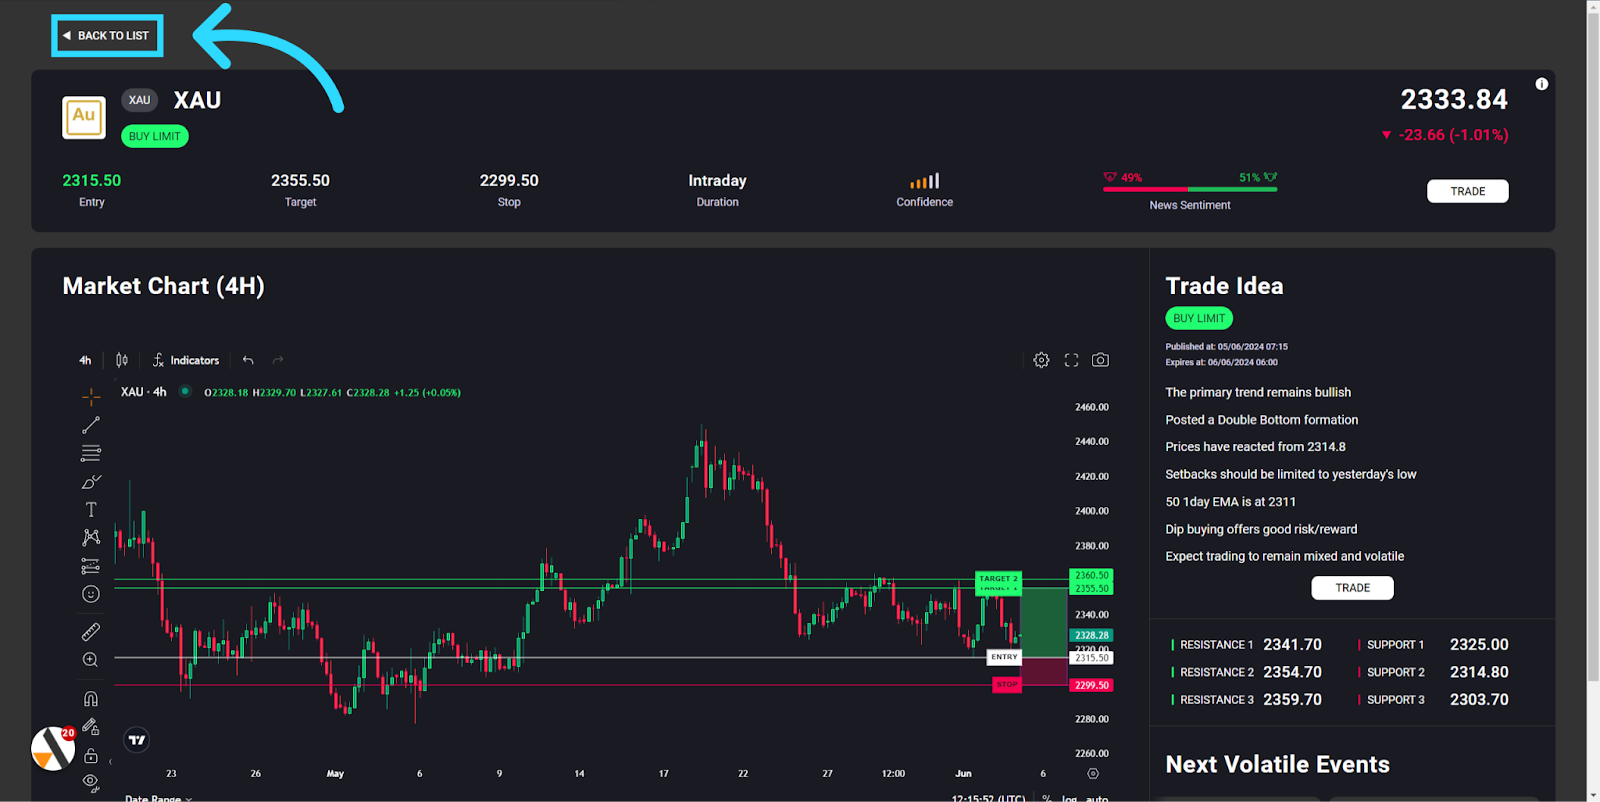
Back to List
Return to the main list by clicking "Back to List."
Get ahead in trading with AnalysisIQ. Acuity offers investors access to the sharpest investment data trends, tools, and analytics. Find your edge with Acuity today.
Additional Resources for AnalysisIQ