
In this document
- Instrument Overview Section
- Acuity Opportunity Score
- Chart
- Events
- Overview
- Summary
- Latest News & Calendar Events
- Associated Assets
- Customisation
Instrument Overview
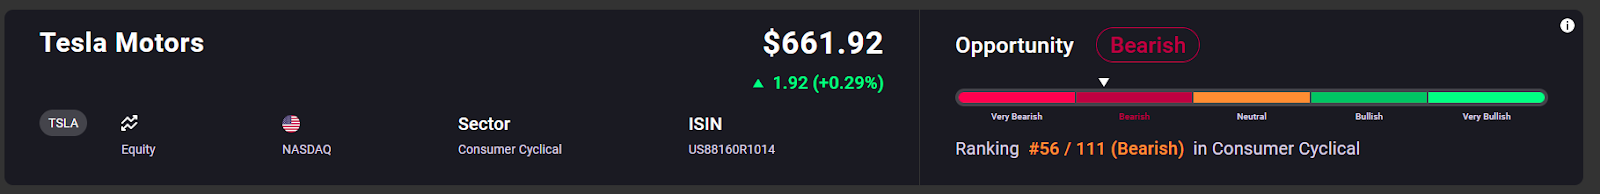
Here is some general information about the instrument, including its asset sector (e.g., Technology) and group (e.g., Metals), as well as its unique ISIN identifier, Latest Asset Price and Recent Price Movement.
Acuity Opportunity Score
This score is determined by considering Price Momentum (whether the price is growing or declining), News Sentiment, Price Volatility, and News Volume Change. More details about this score will be provided below in the document.
The Opportunity Score is compared to the sector or group of the asset, resulting in an overall ranking that indicates the strength of this particular opportunity compared to its peers.
Scoring Method
- Very Bullish - Opportunity Score between 51 and 100
- Bullish - Opportunity Score between 1 and 50
- Neutral - Opportunity Score = 0
- Bearish - Opportunity Score between -1 and -50
- Very Bearish - Opportunity Score between -51 and -100
Chart

The default view is the line chart with the area chart illustrating the correlation between news sentiment and price, which helps users understand how they are interconnected.
In the other view, the candlestick chart, also combined with news sentiment, replaces the area chart with a line chart for sentiment. This modification aims to make the chart appear less cluttered.
Events
Line chart has a feature of plotting events:
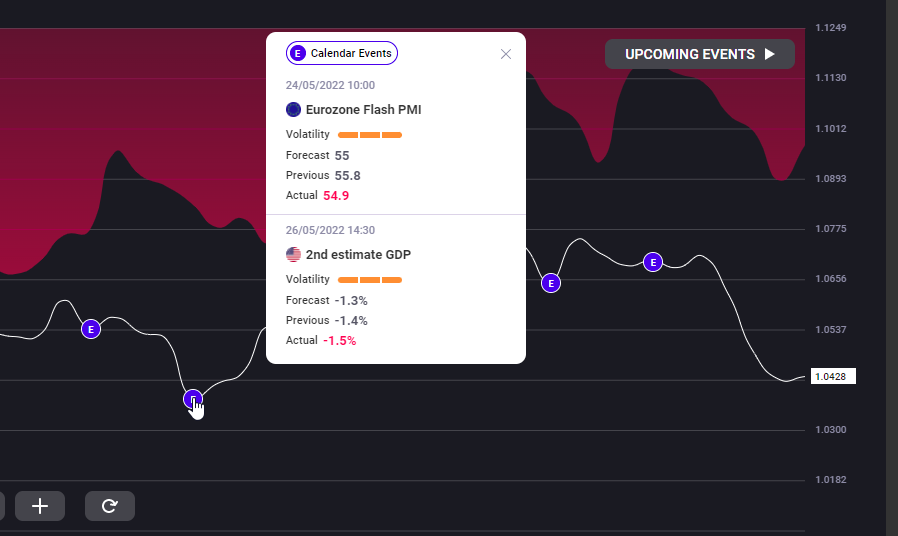
Calendar Events (option selected by default) - Earnings for Stocks, High Volatility Events for other asset classes. These events can be helpful in understanding how specific events may impact the price and anticipate future price movements. Potential price ranges are also provided for consideration.
Upcoming Events - High Volatility Events and Earnings. Users can easily view the Potential Price range and add the event to their calendar. This feature allows users to stay informed about impactful events happening in the next week and plan accordingly. Users have the flexibility to add events to their preferred calendar.
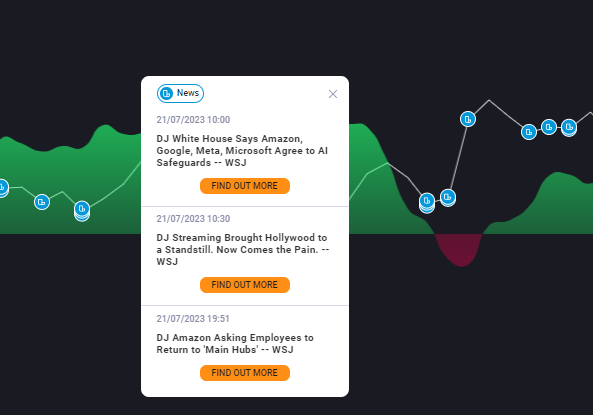
News Articles include significant news stories related to the chosen instrument. This feature helps assess how the market reacts to impactful news items.
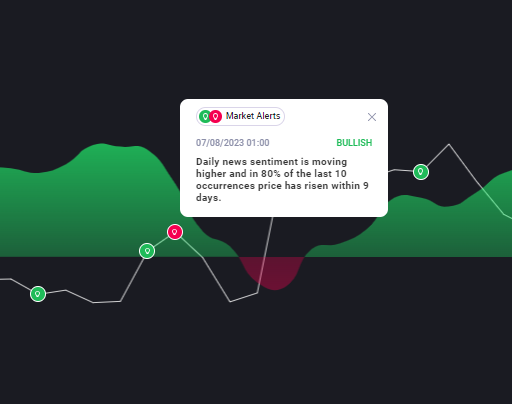
Acuity Market Alerts are generated based on sentiment and price movement, providing a signal that includes the potential duration of price growth or decline.
Overview
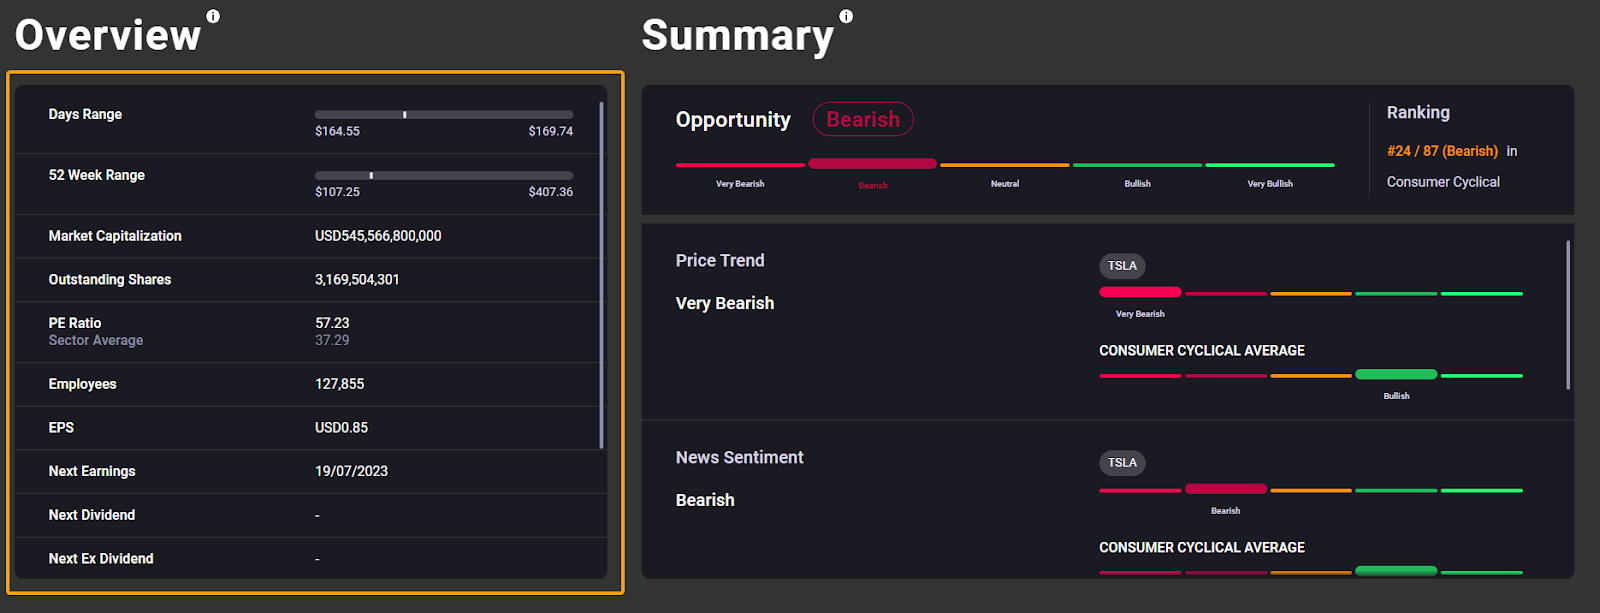
The Overview section provides essential information about the asset that can help users make more informed investment decisions.
For instance, the PE Ratio and its comparison to the sector average offer valuable insights into whether the stock may be overvalued compared to its peers.
Investors focused on dividends will find the Dividend Yield particularly useful. It is also beneficial to compare the Dividend Yield with the sector. If the dividend yield is unusually high, it could indicate a rapid decline in the stock's value.
Additionally, the Overview includes other data points such as upcoming impactful events, pivot point, support and resistance values for other asset classes.
Summary

Summary is an expansion of the Acuity Opportunity Score that is briefly shown at the top of the widget in the Instrument Intro section.
Here we see all the components that comprise the Opportunity Score:
- The Price Trend, also known as the Price Momentum, reflects how rapidly the price is either increasing or decreasing. This calculation involves multiple EMA crossings and comparisons with the price.
- News Sentiment - This metric measures the ratio of financially positive news articles to financially negative news articles.
- Volatility - this is based on current price movement comparison with the average, which uses an ATR (Average True Range) based calculation.
- The News Volume is determined by the Relative Change of Volume score generated by the Acuity Sentiment Analysis Engine. It compares the current news volume with the average volume and provides a value that indicates whether there is an increase or decrease in the news volume. When the RCV is higher than average, it indicates that this instrument is receiving unusually high news coverage.
- Price Trend and News Sentiment are the main indicators
- The higher the news volume spike, the more significance the News Sentiment gets, and the higher the volatility, the higher significance Price Trend gets.
Each section includes the Information (‘i’) icons, which are explaining this in greater detail, so users don’t need to memorize this logic.
News & Calendar Events

These news articles and calendar events are published to keep users informed about the asset and its sector or group. They provide an overview of what's happening with the asset itself, as well as its peers, offering additional opportunities for users to explore.
The news articles not only include the news text itself but also provide tags that help users quickly identify the importance of the articles and their relevance to the current asset.
Please note that this content may not be accessible unless you have access to Dow Jones or the FXStreet services.

Calendar Events include the event type (Earnings, Dividends, Calls/Webcasts, IPOs, Stock Splits, Economic Events) and they also allow viewing the potential price movement range based on the previous events.

Associated Assets

Associated Assets show the assets that are most often mentioned in the news articles together with the currently selected instrument).
It includes the current price and the latest price change in absolute and percentage terms as well as the Acuity Opportunity Score, and how it changed in the past.
Customisation
The page can be customised to match the broker's platform and to limit or enhance certain functionality.
The details on customisation can be found on this page.
If you haven't found what you're looking for yet, don't worry! Our team is here to assist you.