New Traders
Typical characteristics of a New Trader
Little experience, want inspiration, lacking ideas, trust expert opinion, want high conviction.
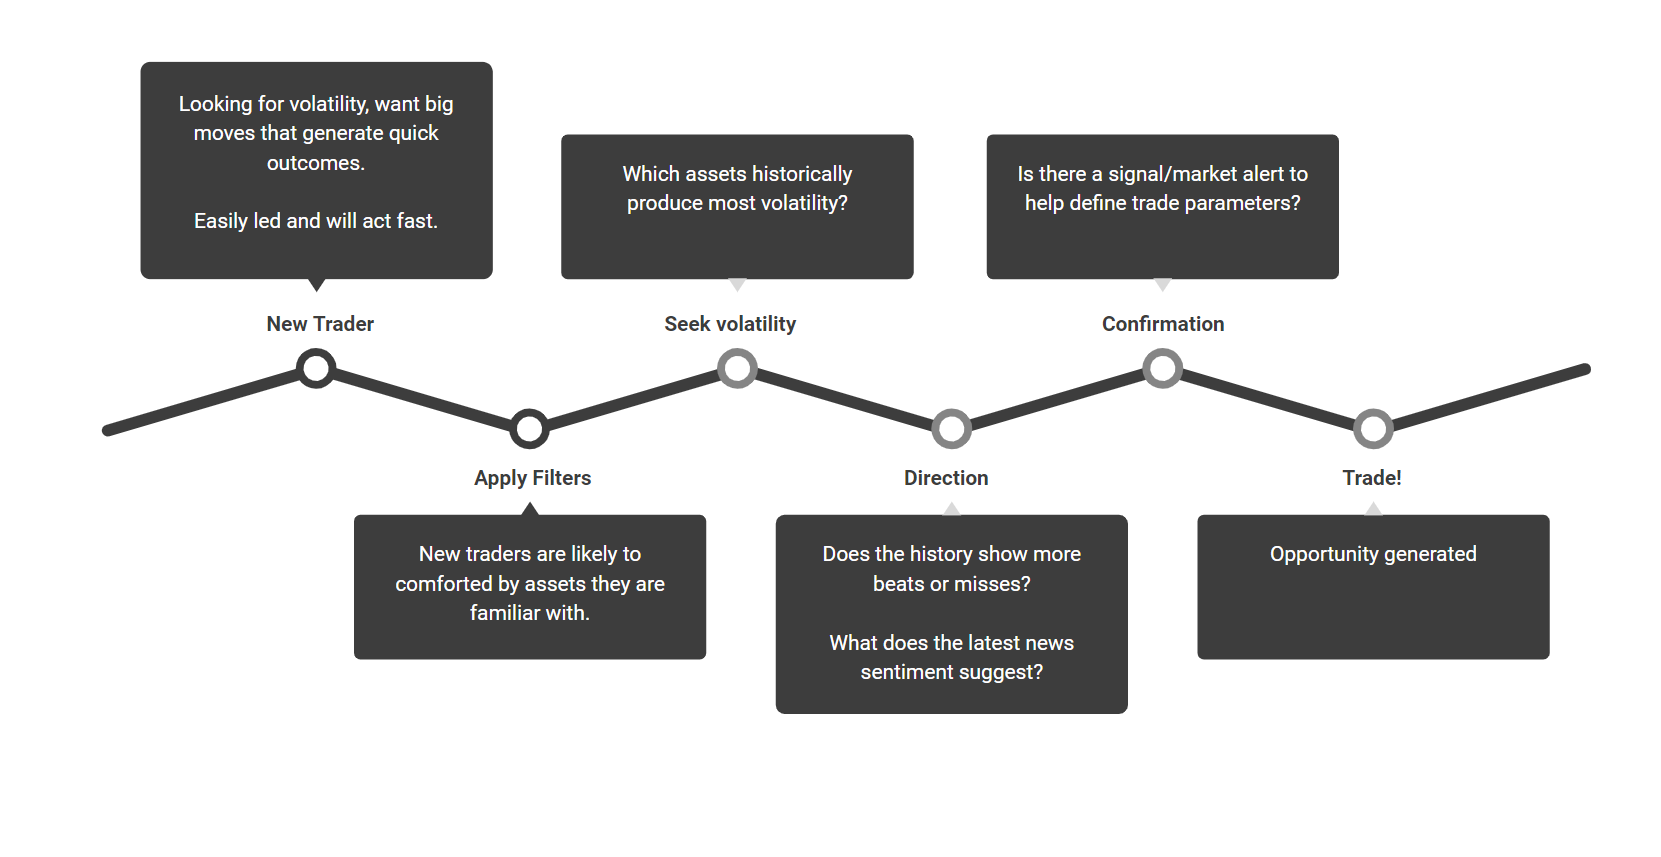
Below is an image of the expected journey a new trader will take using our calendar tools.
The first area a new trader will see is the 'Calendar Home Page' section.
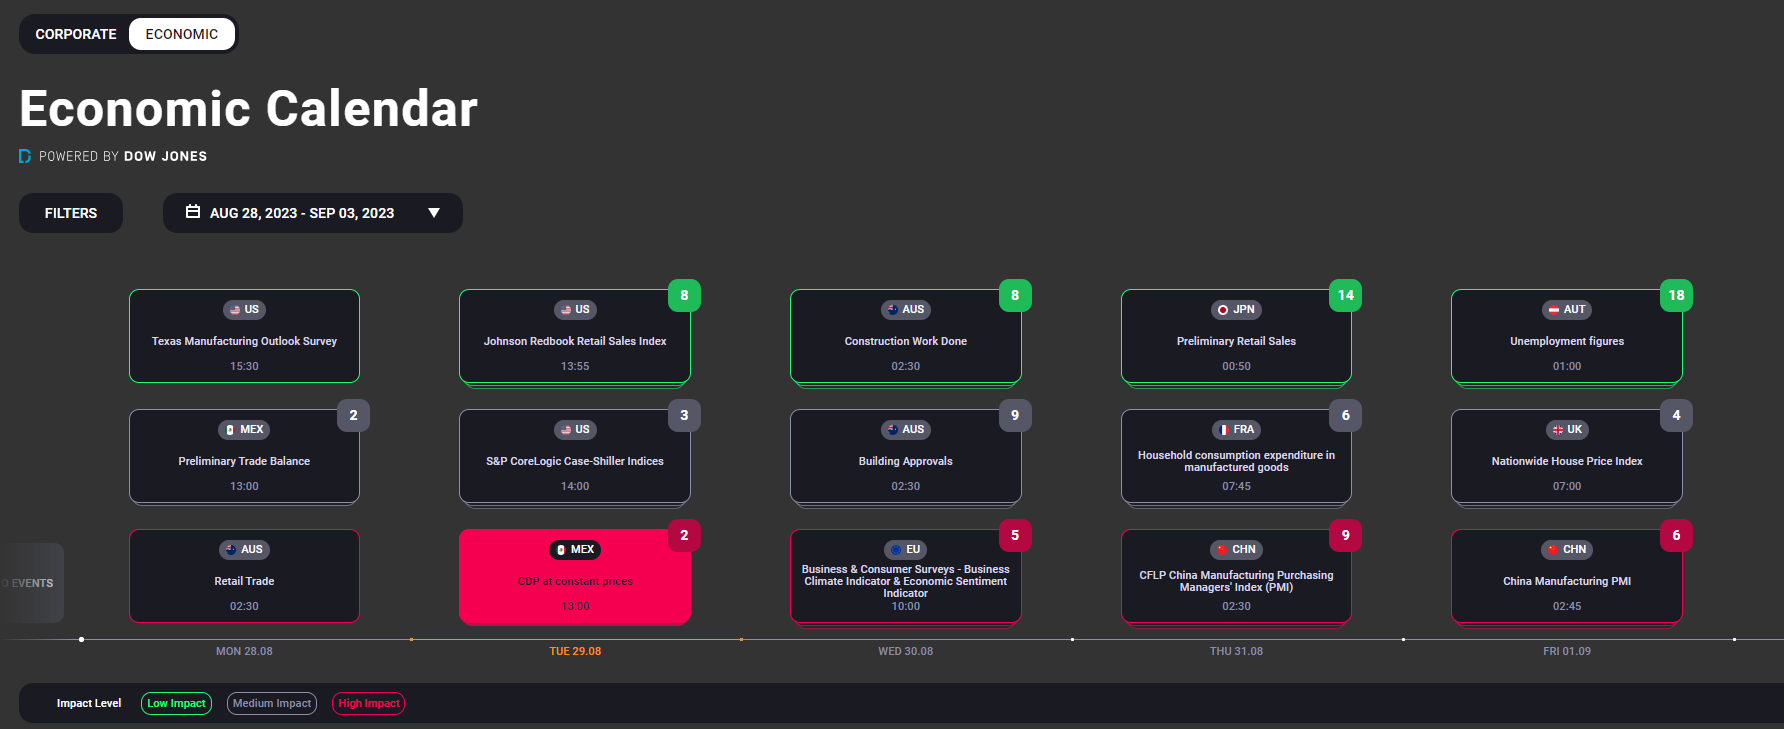
Economic Calendar
Corporate Calendar
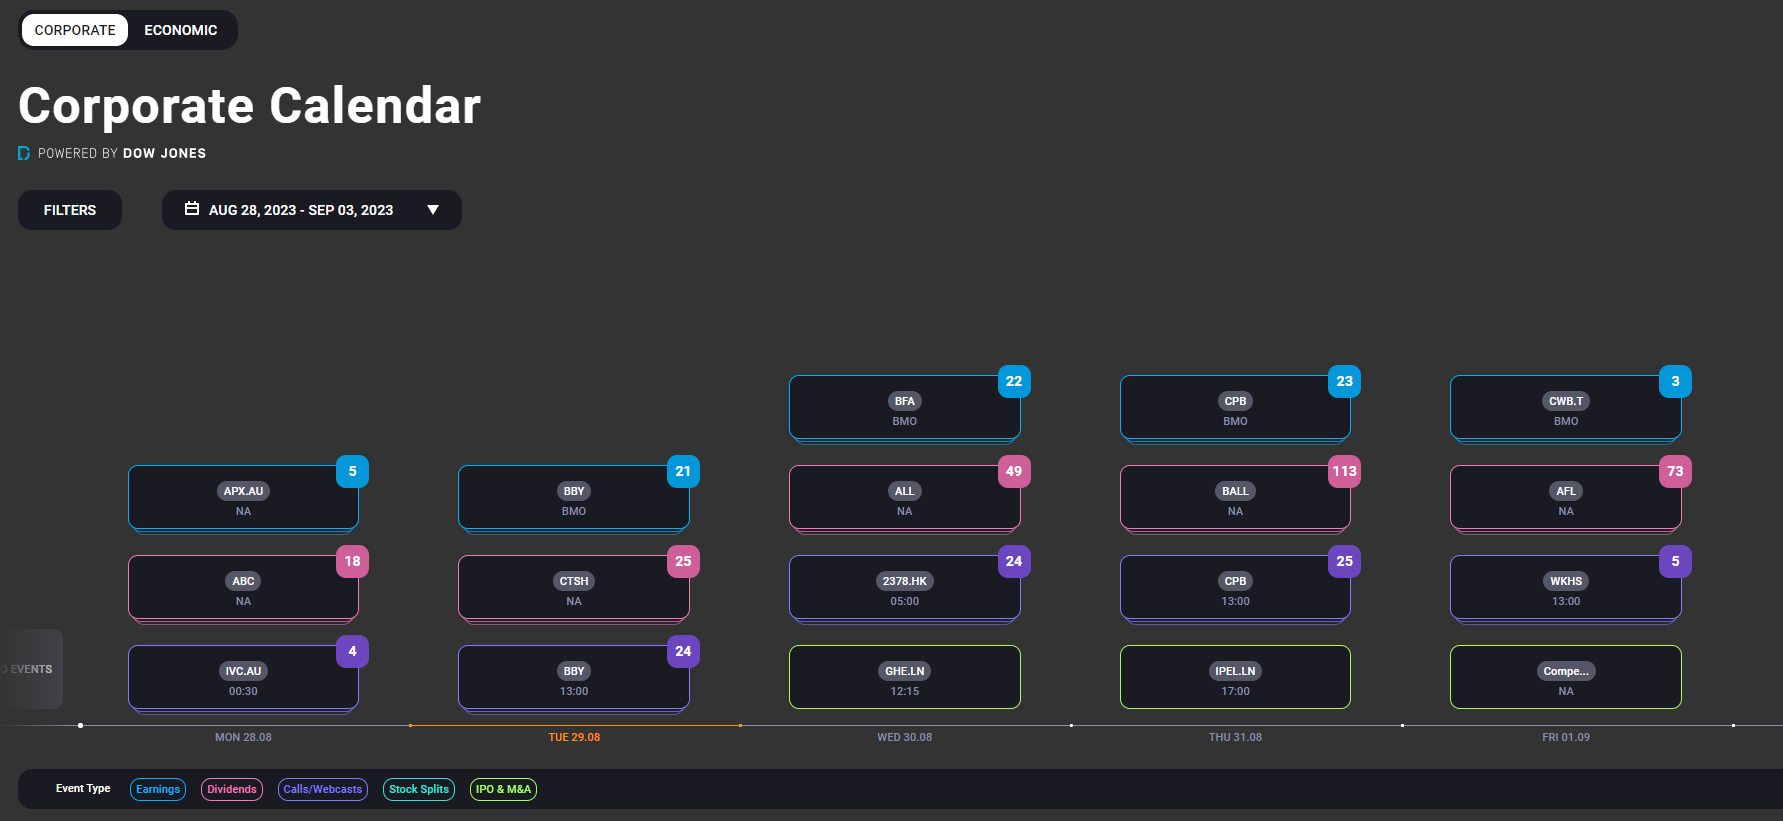
These pages highlight ALL upcoming events for the week ahead, categorised in various ways
Economic Calendar
- Low Impact - Lowest expected volatility
- Medium Impact
- High Impact - Highest expected volatility
Corporate Calendar
- Earnings - Highest expected volatility
- Call/Webcasts
- Stock Splits
- IPO/M&A
- Dividends - Lowest expected volatility
It is commonly expected that 'New Traders' will seek out the highest volatility events, as this is likely to generate a fast outcome. (win or lose).
They are also likely to seek out markets/assets that are familiar.
Filtering options
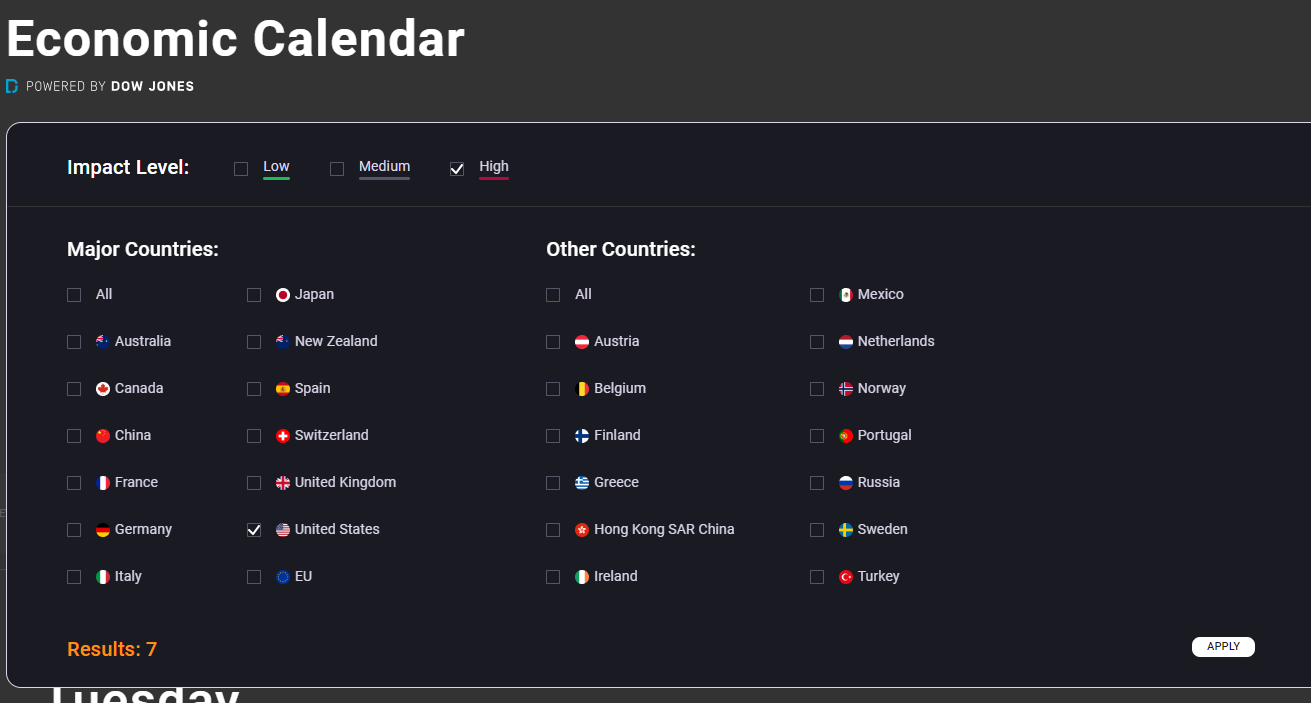
Economic Calendar Filtering Options
Example: High → United States
(High = Highest volatility expected. United States as most commonly traded assets in FX, Indices, & Commodities are highly correlated with the US Dollar)
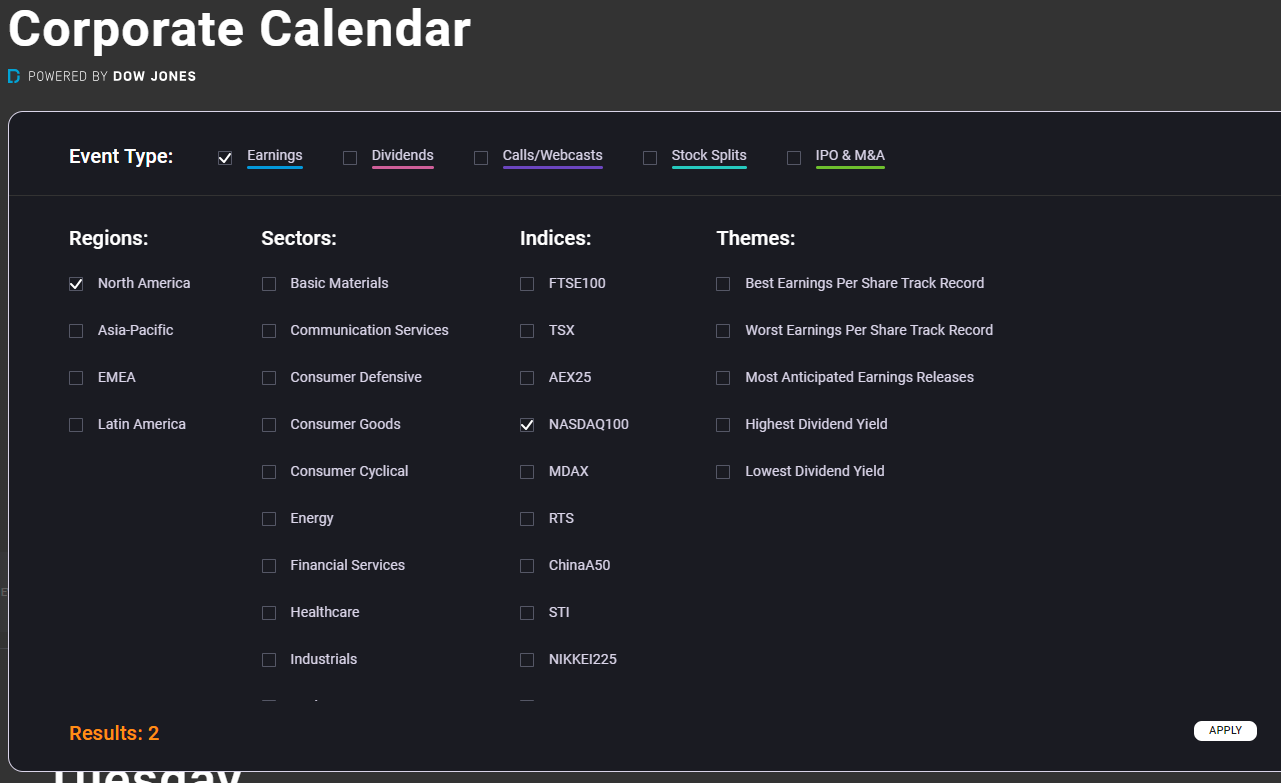
Corporate Calendar Filtering Options
Example: Earnings → North America → NASDAQ100
(Earnings = Highest volatility expected. North America is a popular region for equities trading and earnings events are particularly well watched. NASDAQ100 is where most of the popularly trade Technology companies are listed)
or
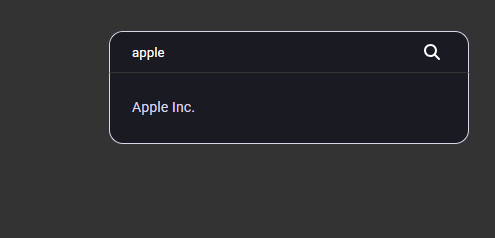
Example: Search Bar → Apple
(a more direct way of finding companies that a trader is interested in)
Finding volatility
Once a specific event has been identified as a point of interest, traders are then likely to go in search of what specific markets have historically produced the most volatility.
Economic Calendar
Markets/assets that have historically produced high levels price movement will be very appealing to a new trader.
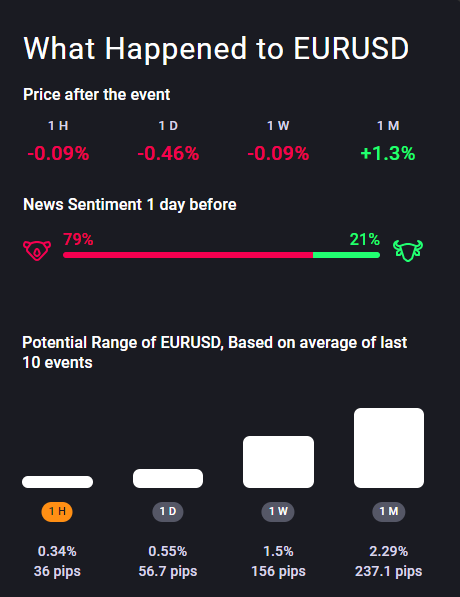
Example: If EURUSD has on averaged move 60pips(points) in the 1 hour after the US Employment Report, that suggests a trader could potentially get in and out of a trade within a short period of time, with a high level of potential reward (or risk).
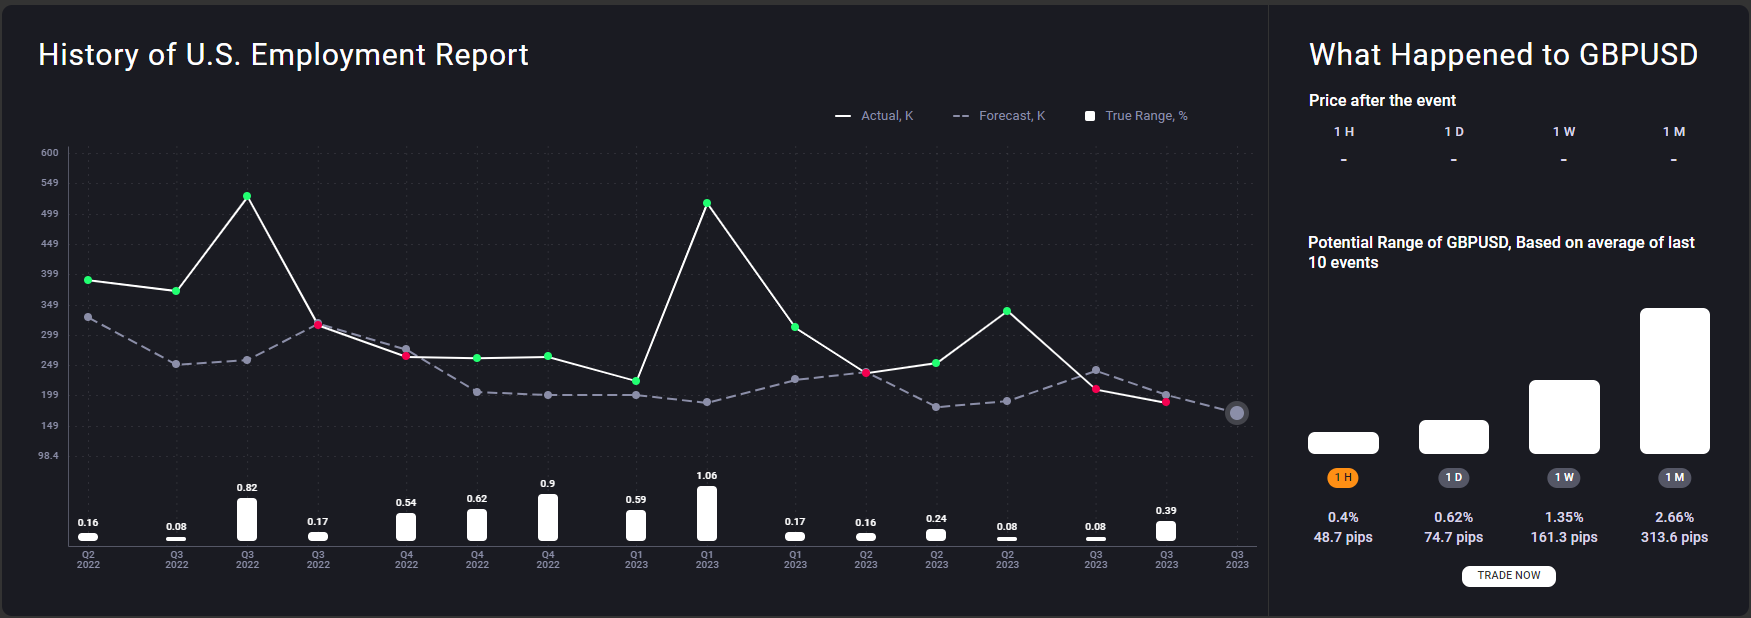
On the image below, we can see what assets are likely to be impacted by the economic event, in this instance the US Employment Report (Non Farm Payrolls)
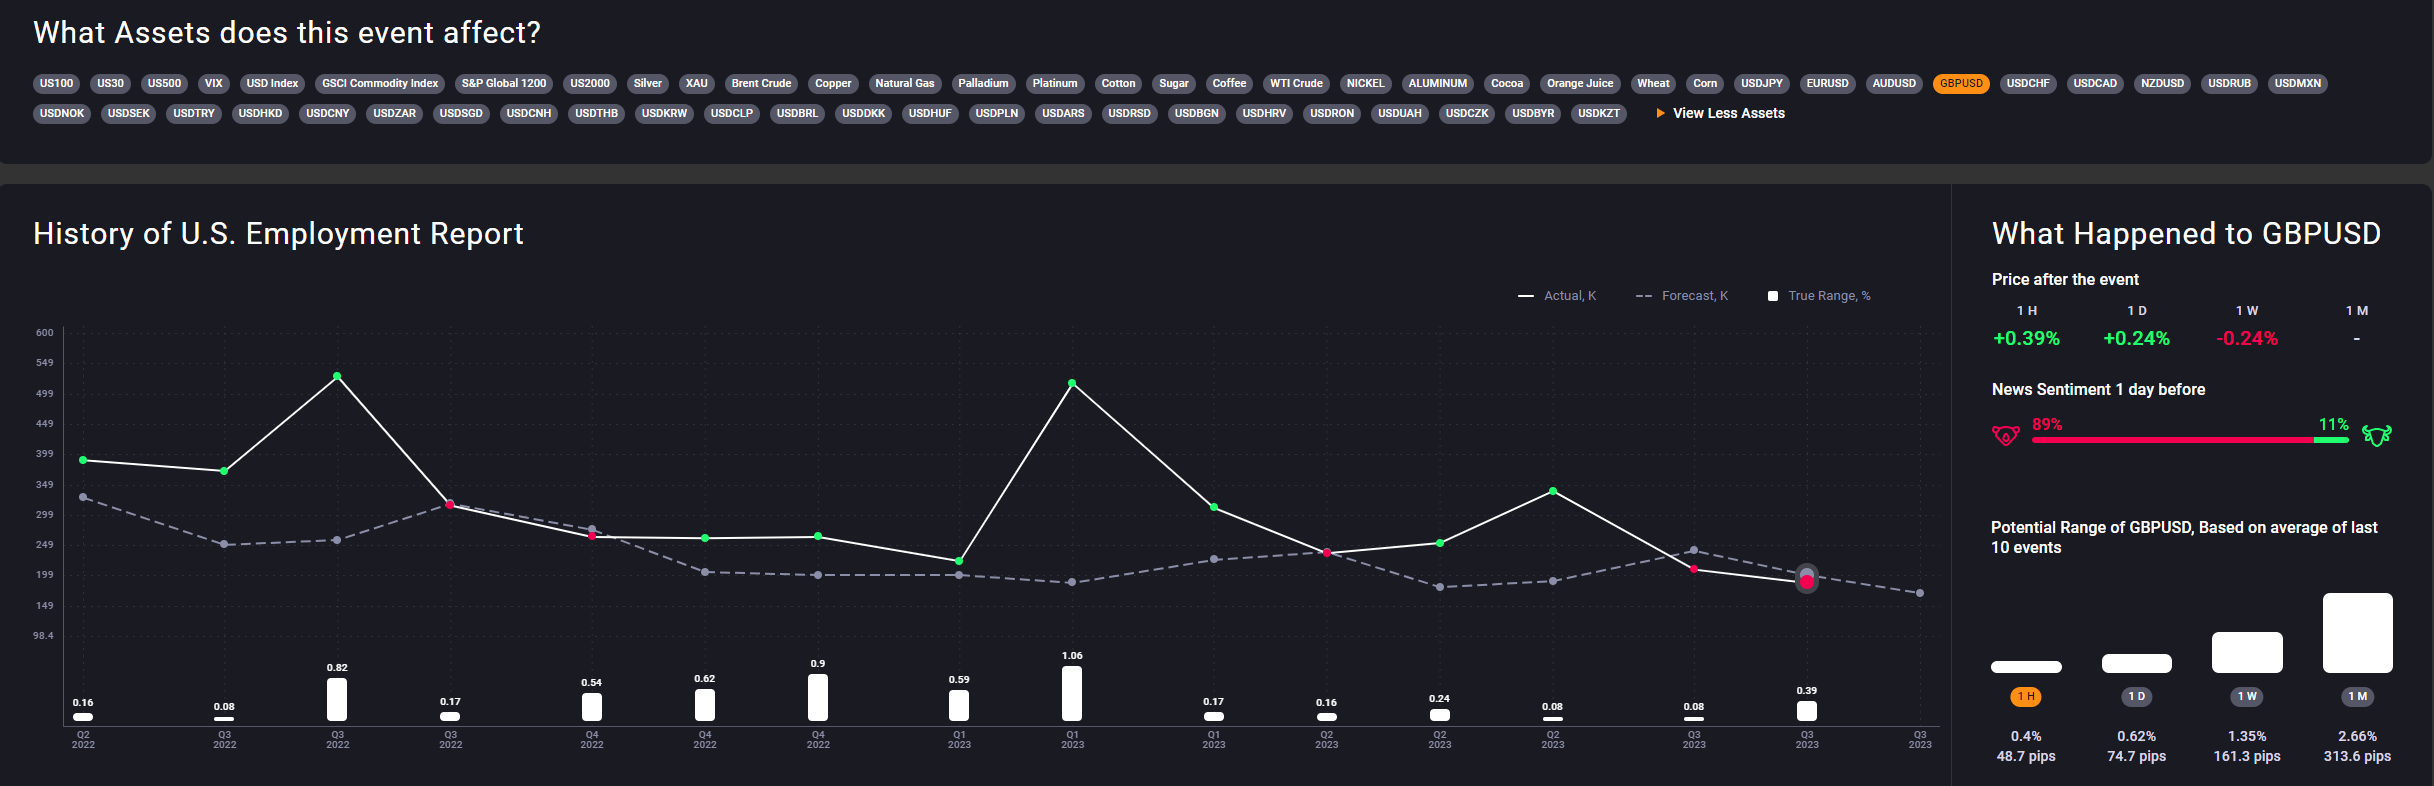
Based on the average of the past 10 events, we can see that GBPUSD has typically moved by 48.7pips(points) or 0.4%, in the 1 Hour period after then event.
Higher volatility or predicted pip(points) movement = Higher interest for new traders.
Corporate Calendar
Stocks or equities that are popular in common culture, such as Amazon, Apple, Netflix and Meta are typically more attractive to 'New Traders'. They are assets that are easily understandable as traders have a rough idea of how the businesses work.
The calendar will automatically place companies that are popular at the front of the lists.
The image below shows the earnings history of Meta Platforms (Facebook/WhatsApp, Etc)
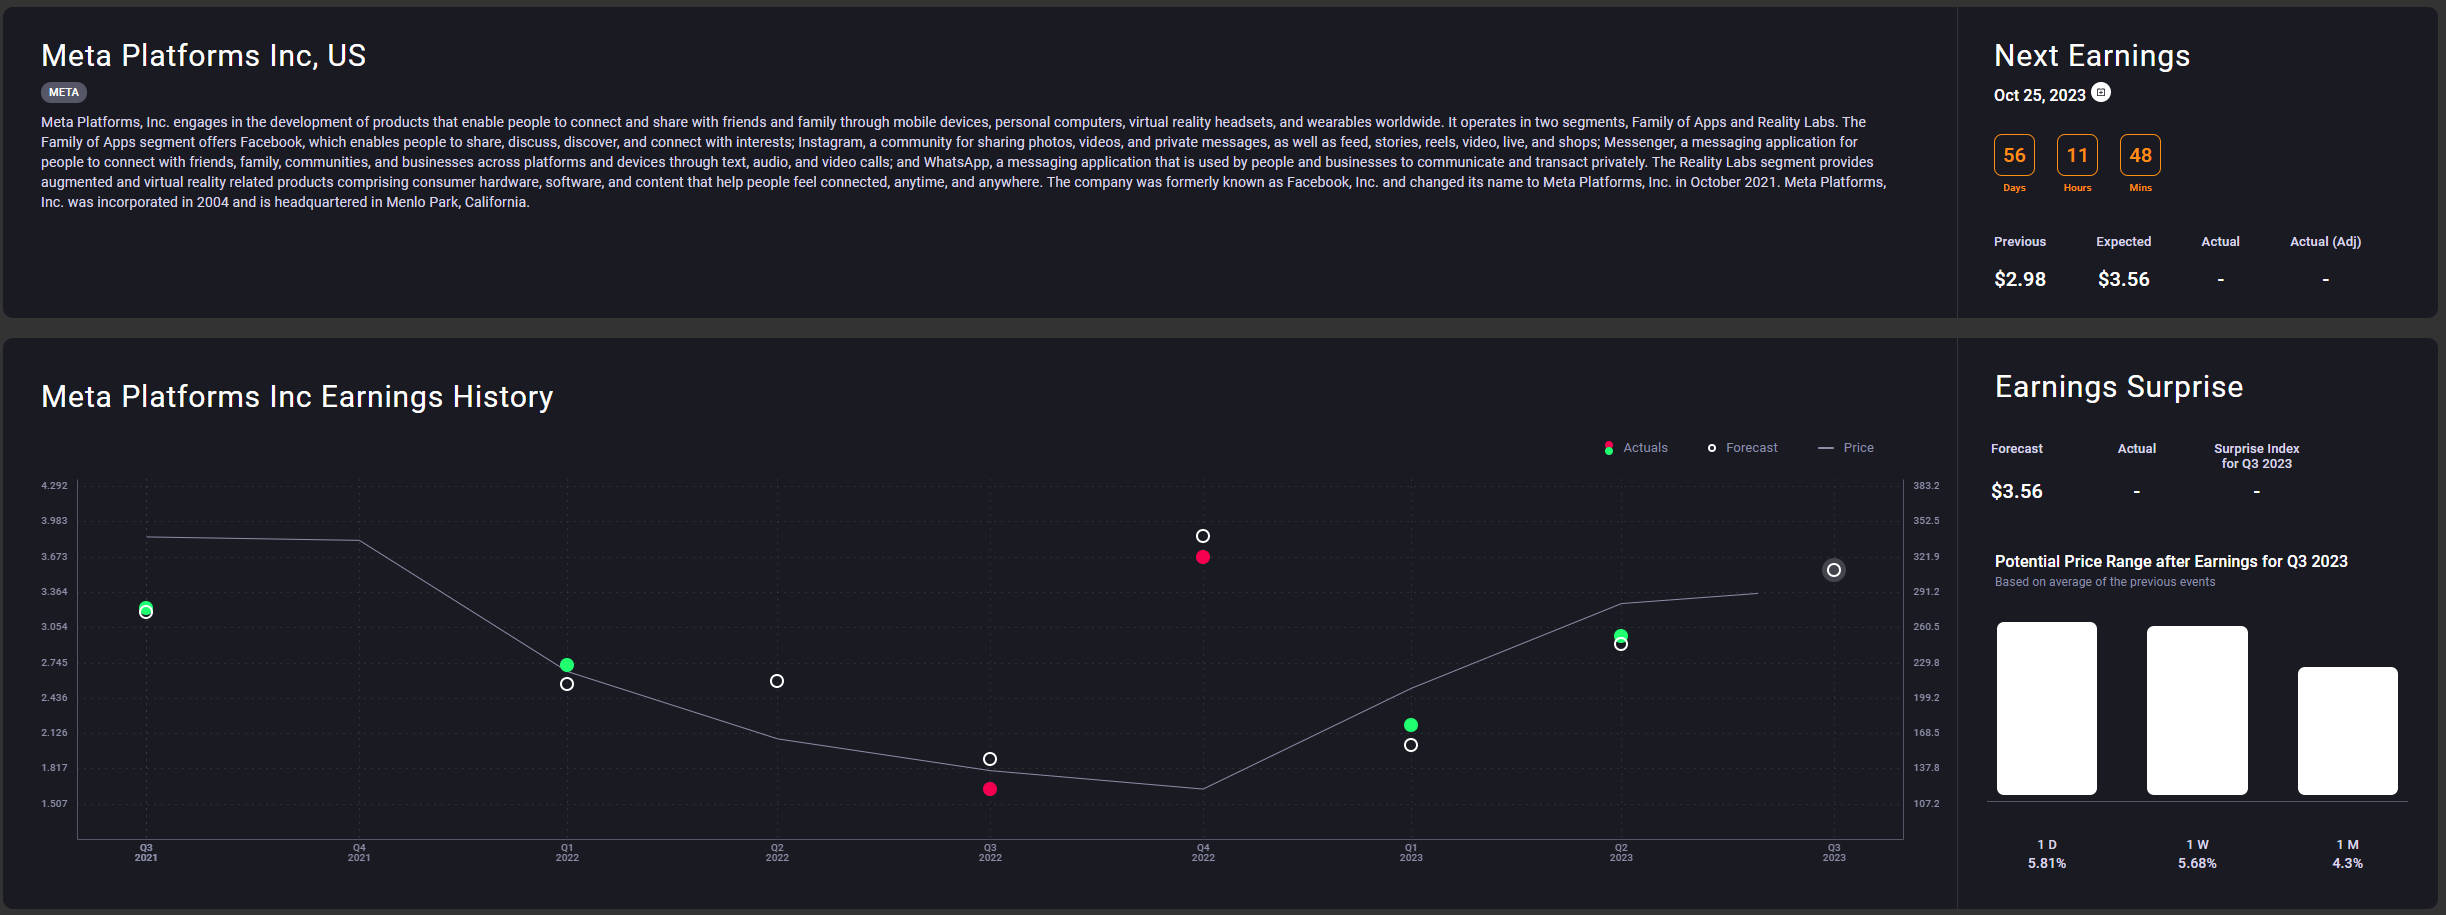
Based on the average of previous events, we can see that Meta Platforms has typically moved by +5.81% in the following day post earnings.
Higher volatility or predicted percentage(%) movement = Higher interest for new traders.
Directional Bias
Now that a specific event has been highlighted, and a particularly asset with high probability of volatility has been established, the new trader will then be interested in what direction (Buy or Sell) they should adopt.
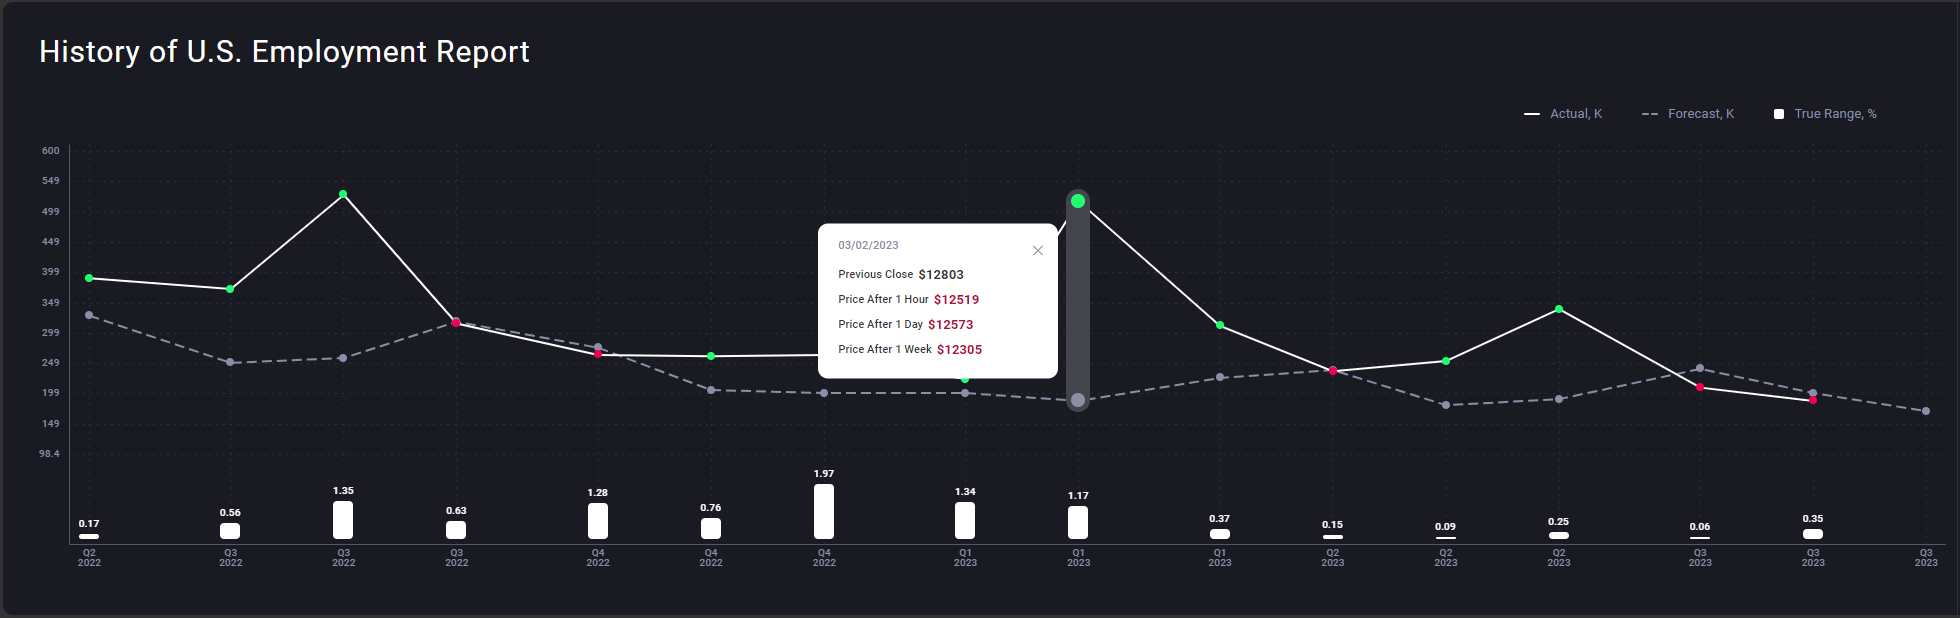
History of the event
Historic events provide an insight into how accurate the forecasts of the events have been previously. Red dots, indicate that the outcome was below market expectations. Green dots indicate that the outcome was above market expectations.
By looking at the history of both economic and corporate events, we can see if there is any consistent trends that emerge.
Example: Meta Platforms has consistently missed earnings estimates, therefore an assumption can potentially be made that they miss earnings estimates again in the future = Bearish/Negative Bias
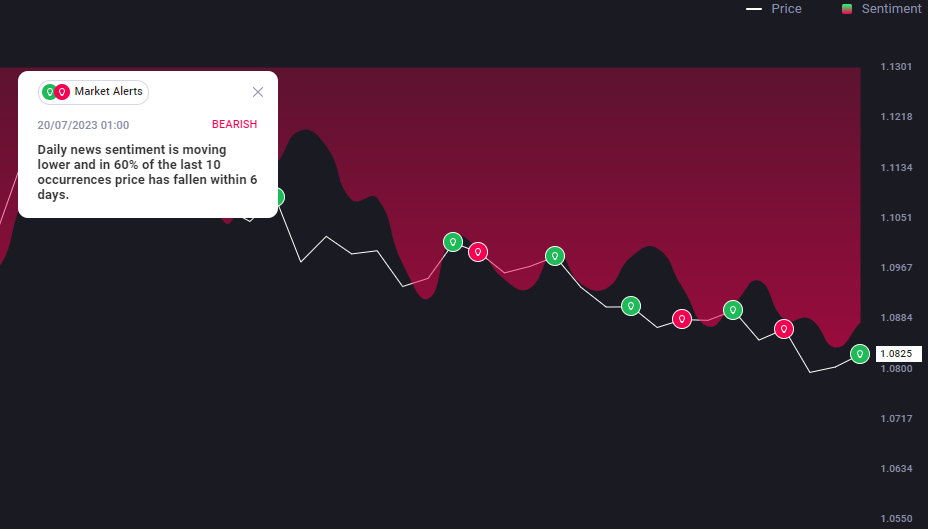
Latest read on News Sentiment
News sentiment may also provide a directional bias on upcoming events, both economic and corporate.
We can check previous events to see what the news sentiment reading was prior to the event. In the below example EURUSD news sentiment was 79% Bearish/Negative prior to the release of the US Employment report.
Prices fell 0.09% in the 1 hour after the event. In this example, establishing a bearish/negative bias on EURUSD, based on news sentiment, would have generated potential returns over the following 1 hour & 1 day.
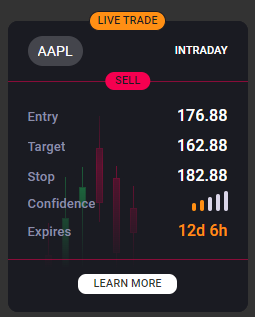
Confirmation
If a trader is still on the fence with regards to taking action, having considered all of the above, then we have additional confirmation tools that will assist with the decision making process.
Traders can access our Market Alerts tool via the Research Terminal, which automatically generates directional signals based on News Sentiment.
Alternatively, traders can access our Signal Stream or AnalysisIQ tool to find direct calls to action, with specific entry, stop and take profit levels on the assets/markets of interest.
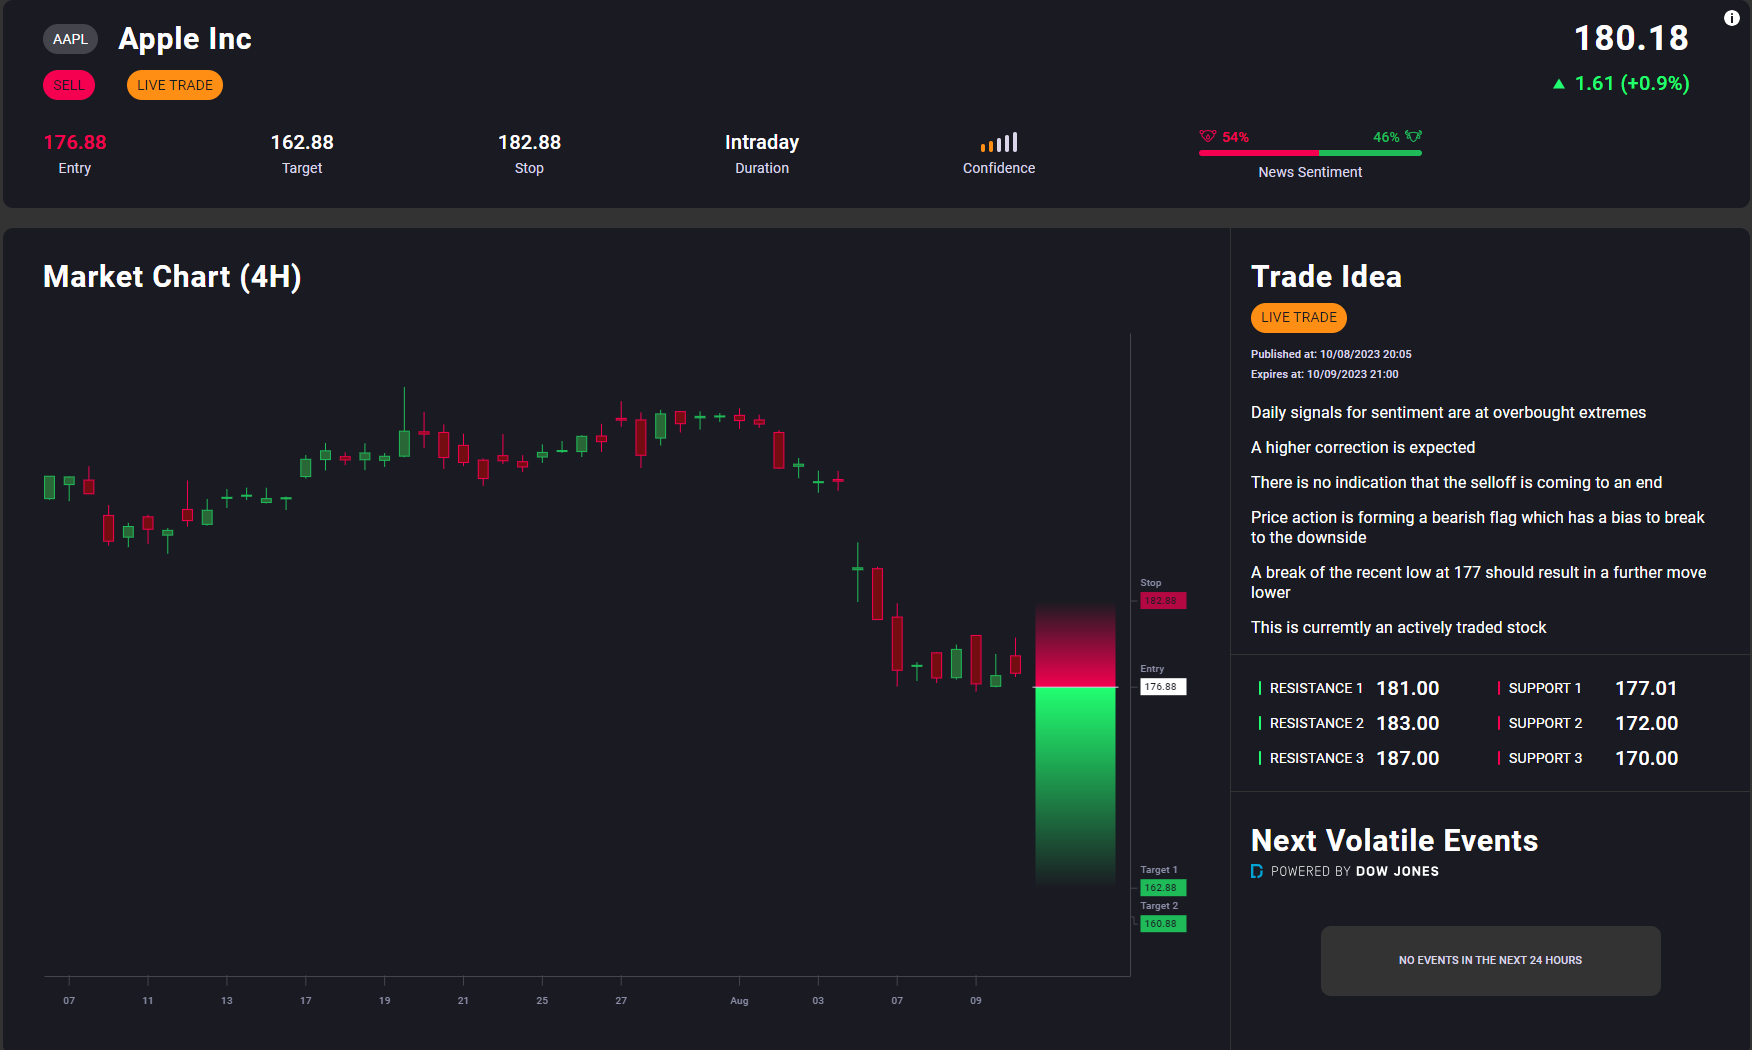
Trade!
Once armed with all of the information available, the 'New Trader' is in a strong position to place a trade, having identified a specific event (Economic or Corporate), highlighted an asset that is expected to have a volatile reaction, decided on a directional bias, and potentially having been given specific levels to trade at.
Call to action buttons are located throughout our tools and products to allow traders seamless access to trading opportunities that arise.
Experienced Traders
Typical characteristics of an experienced trader
Likely to have their own thoughts and ideas when it comes to trading. Unlikely to be influenced by opinions. Likely to conduct deeper levels of research.
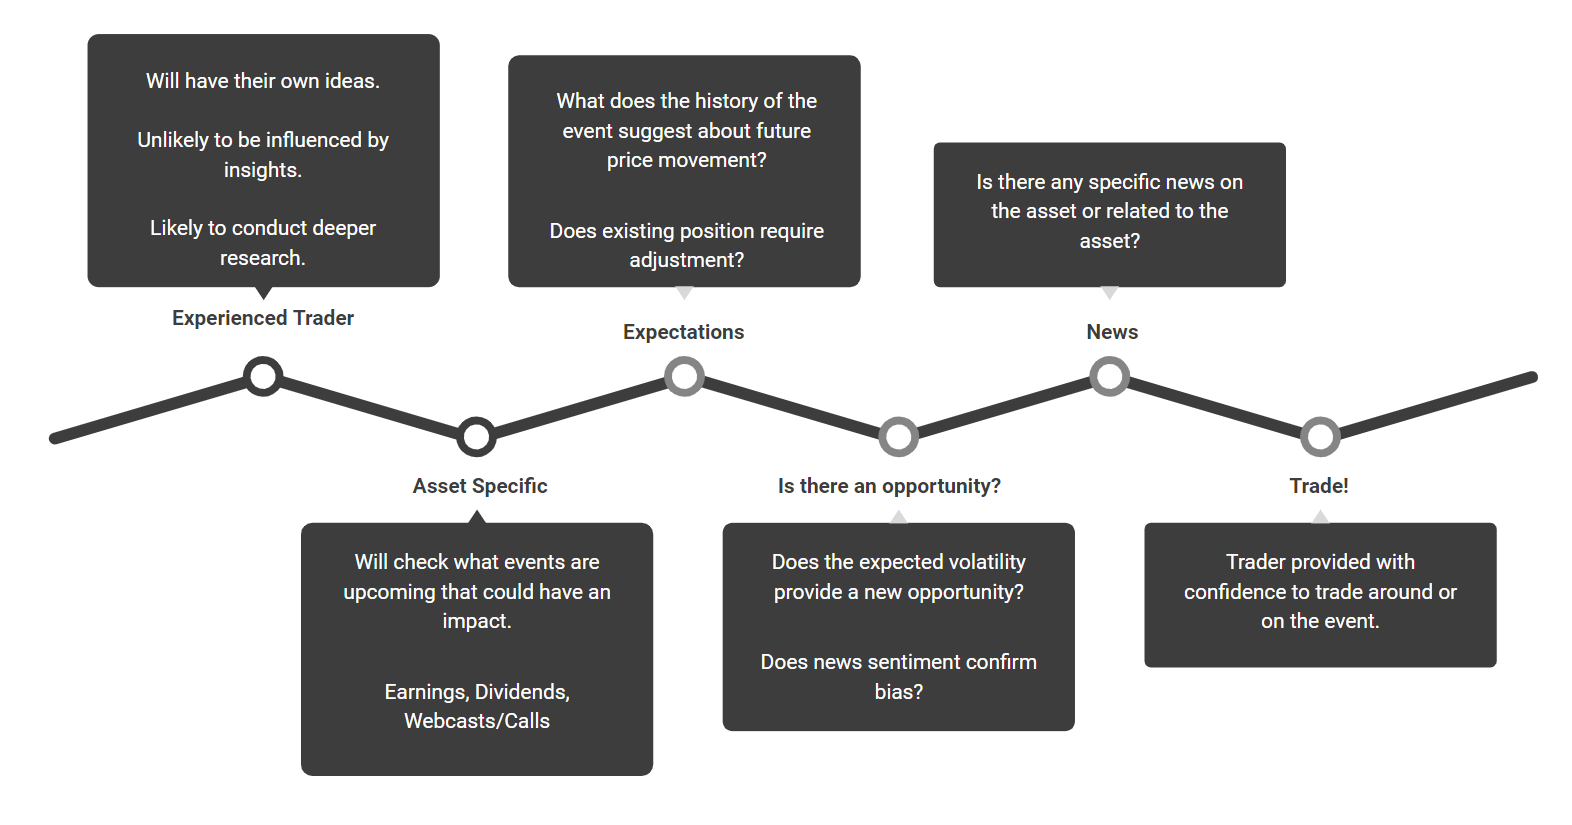
Below is an image of the expected journey an experienced trader will take using our calendar tools.
The first area a new trader will see is the 'Calendar Home Page' section.
Economic Calendar
Corporate Calendar
These pages highlight ALL upcoming events for the week ahead, categorised in various ways
Economic Calendar
- Low Impact - Lowest expected volatility
- Medium Impact
- High Impact - Highest expected volatility
Corporate Calendar
- Earnings - Highest expected volatility
- Call/Webcasts
- Stock Splits
- IPO/M&A
- Dividends - Lowest expected volatility
It is commonly expected that 'Experienced Traders' will already have a firm opinion on assets/markets they typically trade.
Their search approach will be far more direct, compared to a 'New Trader' who may require inspiration.
Asset specific approach
Experienced traders are likely to use the calendars for information purposes, such as checking which events are upcoming for the day/week ahead, with respect to existing positions they own.
With regards to the Corporate Calendar, a more direct searching method of companies of interest is likely.
Example: Search Bar → Apple
(a more direct way of finding companies that a trader is interested in)
Expectations
We expect experienced traders will be interested in using information that can paint a clearer picture around expectations of events.
Information such as...
- How accurate have recent forecasts been with regards to the event in question.
- Typically how much volatility has there been on these events previously.
- What is the average range of the market they follow in the hours, days and weeks post event.
With this information an 'experienced trader' can manage positions accordingly, such as tightening or widening stop loss and take profit levels, or simply closing positions completley to avoid volatility and manage risk.
Is there opportunity?
Through the display of volatility expectations on various events and assets, experienced traders may be better positioned to capitalise on such movement. Typically an experienced trader will be more focused on risk management when compared to a new trader. Therefore an experienced trader may be able to extract more value from these tools.

Similarly using news sentiment, an experienced trader will be in a better position to utilise the news sentiment and price charts to highlight divergences between the two sets of data.
Example: News Sentiment is moving higher, indicating improving sentiment in the short term. Price however is moving lower. It may be that news sentiment has historically been a leading indicator on certain assets, which may provide a trading opportunity for the more experienced trader.
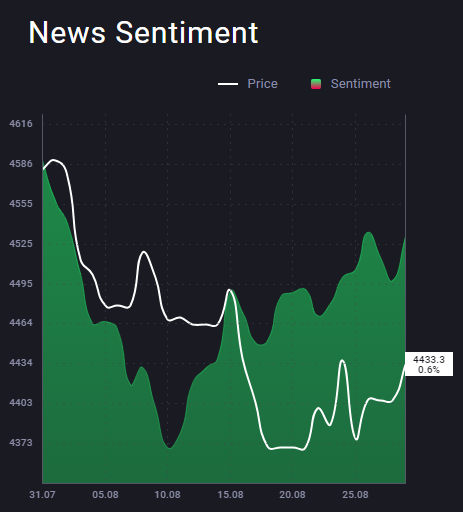
In the example above the US500 news sentiment (green) has been trending higher since the 10.08. The US500 price however is lagging behind, indicating that potentially the price is set to follow the sentiment reading to the upside.
News
An experienced trader is likely to be more inquisitive, particularly around the assets/markets they typically trade. News stories and articles will be a useful tool to improve their knowledge around the macro fundamental landscape and help to form better views on markets.
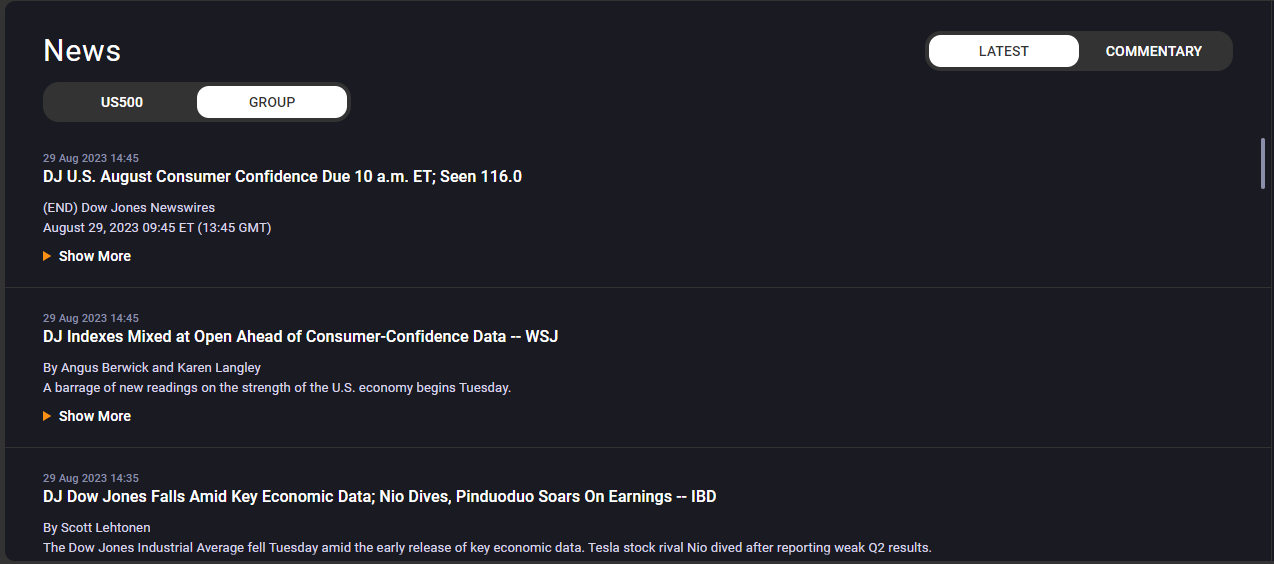
Experienced traders can use the news function within the calendar tools to find the most up to date news and commentary impacting their asset/market of choice, as well as industry groups and associated assets/markets to help inform their view.
Trade!
Once armed with all of the information available, the 'Experienced Trader' is in a strong position to make more informed decisions on the assets/markets of interest and manage existing positions.
Call to action buttons are located throughout our tools and products to allow traders seamless access to trading opportunities that arise.
If you haven't found what you're looking for yet, don't worry! Our team is here to assist you.