In this document
- Benefits of using the Corporate Calendar
- Page navigation

Broker Benefits
- Generates revenue through increased deposits and volumes
- Creates unique and highly engaging content marketing opportunities
- Offers unique brand differentiation opportunities
- Offers customisation without developer resources required
- Delivers a fast return on investment with quick integration and deployment
Trader Benefits
- Quick and easy-to-find trading opportunities.
- Optimise entry/exit times to capitalise on opportunities and manage risks - before, during and after events.
- Plan trading strategies in advance.
- Leading style indicators for informed planning and decision making.
- Switch between corporate and macro events for complete, multi-asset trading and research.
Note: this content will not be available without the Dow Jones Corporate Calendar subscription.
How to navigate the Homepage
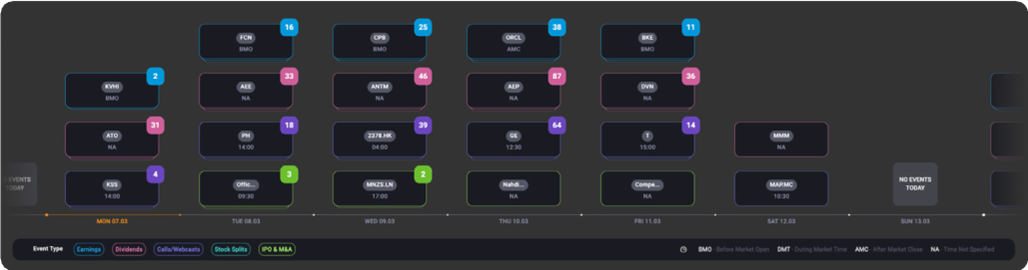
Event Type
Earnings: official statement of a company’s profitability for a specific period.
Dividends: announcements of dividend pay-outs by a company.
Calls / Webcasts: teleconference organised by a company to discuss the financial results of a reporting period.
Stock Splits: announcements relating to the issuance of additional shares by a company.
IPO / M&A: announcements of new stock issuance by a company or consolidation of companies and/or assets via a corporate action.
Event Publishing Time
BMO: Before Market Open.
DMT: During Market Time.
AMC: After Market Close.
NA: Time Not Specified.
How to find an event
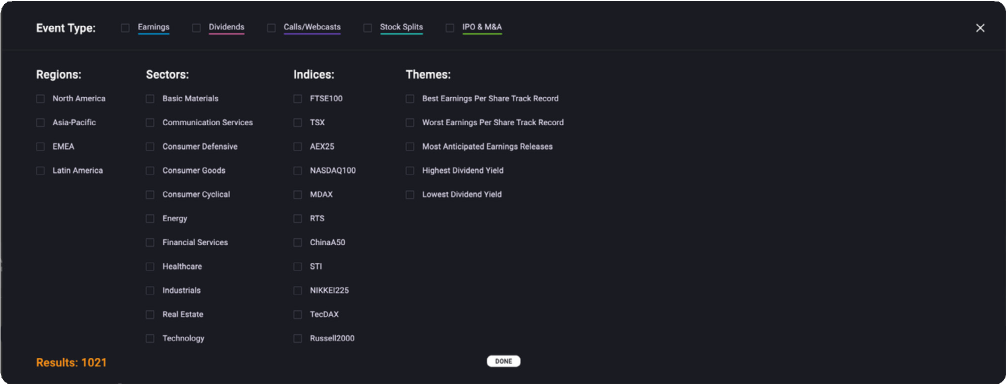
You can find an event by utilising the available filter options. These include:
Filter Panel
- Event Type
- Region
- Sector
- Indices
- Themes*
*Themes are unique to Acuity’s Corporate Calendar. They use AI technology to analyse assets according to pre-defined criteria.
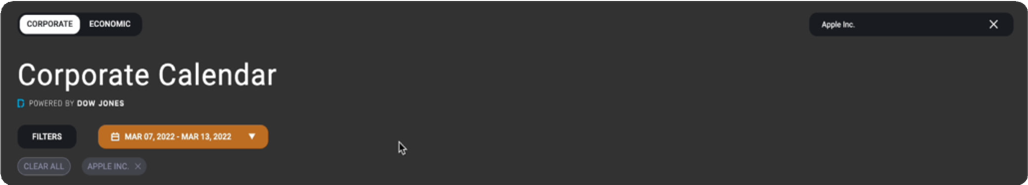
Filter by asset name
Simply type the name of the company you wish to search in the box on the right.
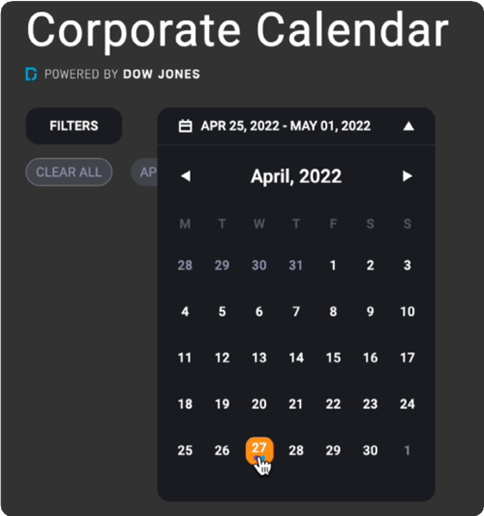
Filter by date
Date picker will move to next event for selected asset and flash orange. Click on drop down to view the next events.
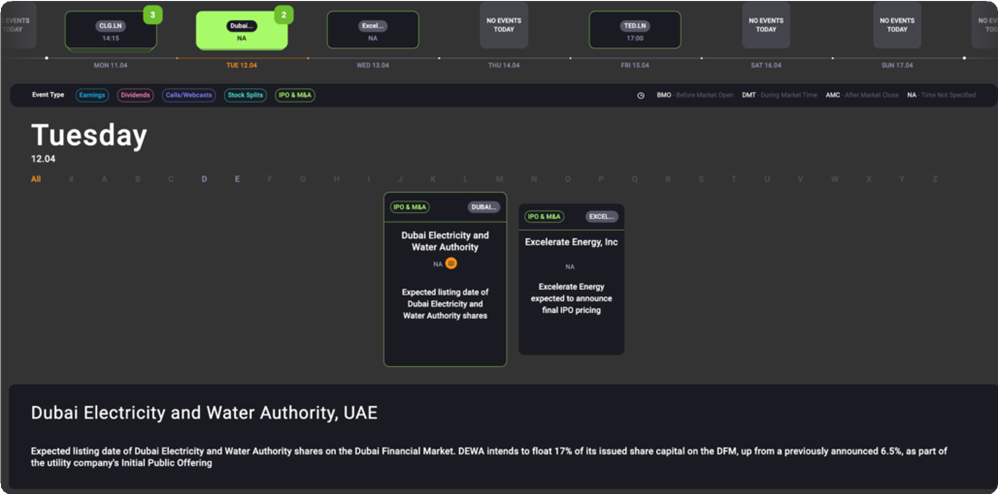
Filter by week/day view
- Events are displayed vertically by day, according to event type.
- The number of events in each category, each day are indicated in the top right corner.
- Select the event type to reveal all events in that category.
- Scroll left / right to see more events in that day
Filter alphabetically
Use the alphabet bar to filter events by asset on a selected date.

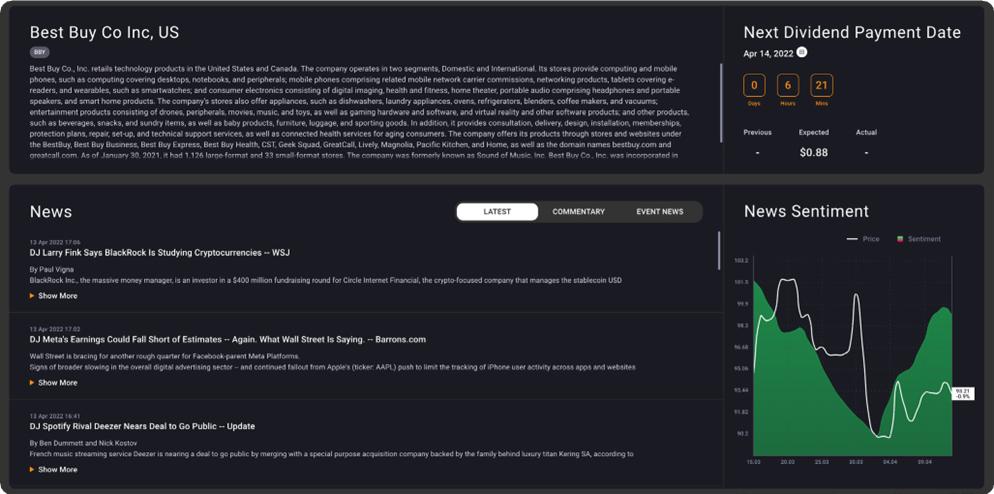
Earnings View
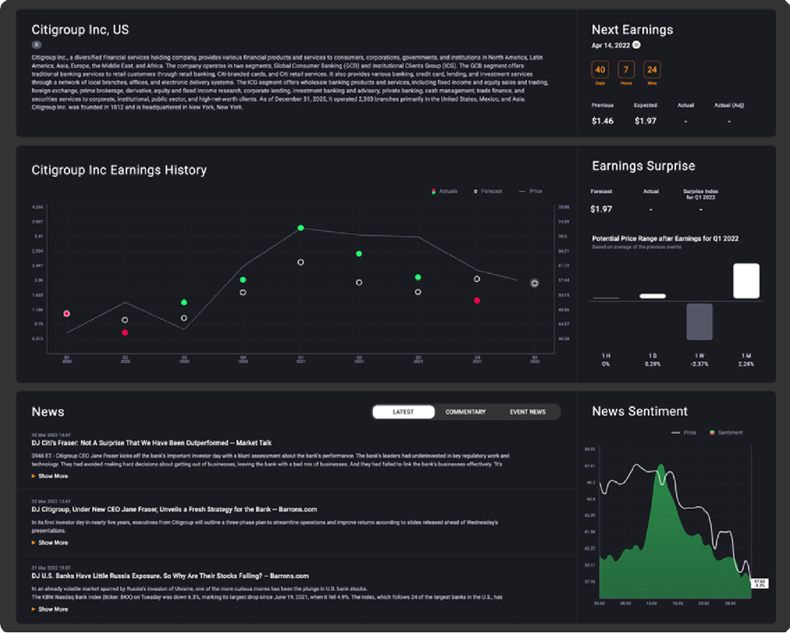
Corporate Description: What does the company do?
Next Earnings Date: Date the next earnings event is scheduled
Time to Next Event: Countdown timer to next scheduled earnings release
Add to Calendar: Seamlessly add the event to a personal calendar to make sure your customers never miss an event.
Earnings Data ( Earnings per share or EPS): What was previous number, what is forecast, what was the actual, adjustments to actual.
Historical Earnings Data
- White circle: Indicates forecast earnings per share (EPS)
- Red circle: Indicates earnings per share (EPS) was below forecasts
- Green circle: Indicates earnings per share (EPS) was above forecasts
- White line: Indicates price movement over the time period
Earnings Surprise Data: Forecast earnings per share (EPS), Actual earnings per share (EPS), Surprise Index (Expressed as a percentage % - By what percent did the company beat or miss the forecast.
Potential range price data by time -
Asset news, commentary and analysis: Latest news regarding the company selected
News Sentiment / Price correlation chart: Snapshot of price with sentiment overlay
Analysing the Event Data
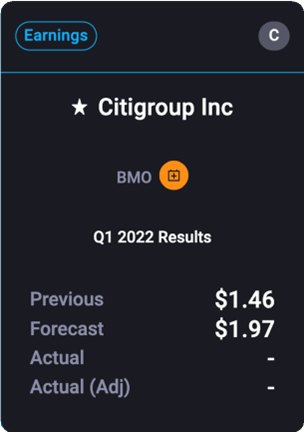
Event Type: Earnings, Dividends, Calls / Webcasts, Stock Splits, IPO / M&A
Asset Symbol: Data provided on over 1,500 companies, globally.
Asset Name: Which company is linked to the event
Event Publishing Time: Before Market Open (BMO), After Market Close (AMC), During Market Time (DMT), Not Available (NA)
Event Name/Description: E.g. "Q1 2023 Results"
Event Data
Previous: The previously reported Actual Earnings result.
Forecast: The forecast for the next Earnings result provided by various financial analysts. Dow Jones aggregates this data and sends to us as a single value.
Actual: This figure is released when the company is reporting the earnings.
Actual (adjusted): US companies need to report earnings using a specific set of accounting principles, called GAAP (Generally Accepted Accounting Principles), so for these companies Dow Jones provides 2 figures - Adjusted Actuals which are counted using GAAP, and Actuals that are not adjusted in any way.
Event Publishing Time
Companies release Earnings data outside of market hours to give all investors a fair chance and to avoid impulse corrections from the market.
In other words, if a big company announces results mid day, some investors could over-react to the news.
Also, traders with faster access to the news and to faster trading platforms would get a small but very valuable advantage to be able to sell or buy stock before others.
Announcing after the market closes, often on Fridays, allows investors to review the data, understand the implications, and make more sensible trading decisions that don’t create short term ups and downs for the company value and don’t put investors at a disadvantage.
Releasing earnings Before Market Open sometimes could lead to higher volatility during the day.
Next Earnings Event
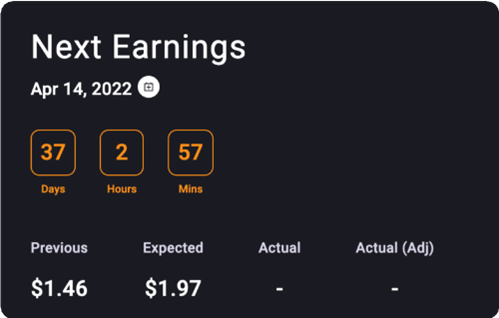
- Date of event
- Add to your calendar shortcut
- Countdown to event, updated every minute This counts down the time until the next event of this type (e.g., if you’re looking at an Earnings event, it will countdown until the next Earnings event).
- Event data (see previous)
Earnings History, Surprise and Price Range
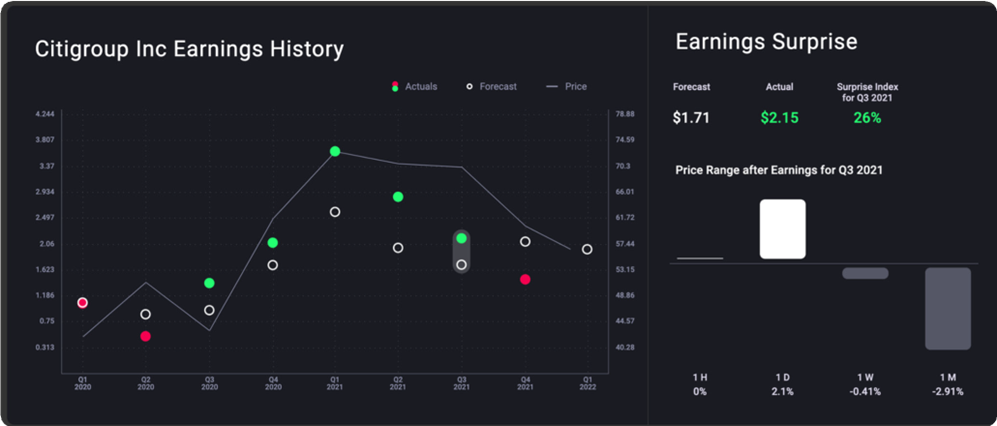
How to use the Earnings Surprise and Potential Price Range as a Leading Indicator
Click on the next Earnings event on the Historical chart. This will reveal the Earnings Surprise index and Potential Price Range data in the panel on the right.
The Earnings Surprise index for future events is calculated using AI and historical data to determine how accurate the forecast is likely to be and whether the event is likely to result in a positive or negative surprise which can therefore help to anticipate the most likely market reaction. The impact of an earnings event depends whether the earnings data meets, exceeds of falls below expectations.
The Potential Range data uses the Earnings Surprise index and historical data to calculate the likely price movement across the four timeframes. This can be used to help time entry / exits and shape trading strategies.
The impact of an earnings event depends whether the earnings data meets, exceeds of falls below expectations.
If an earnings announcement fails to meet or exceeds expectations, this ‘gap’ between the forecasted and actual data is known as the ‘Earnings Surprise’.
A positive earnings surprise will often lead to a sharp increase in the company’s stock price as well as a gradual increase over time while a negative surprise will often lead to a rapid decline.
The speed at which the market reacts and the price moves varies between assets. This is displayed in the Price Range after Earnings chart.
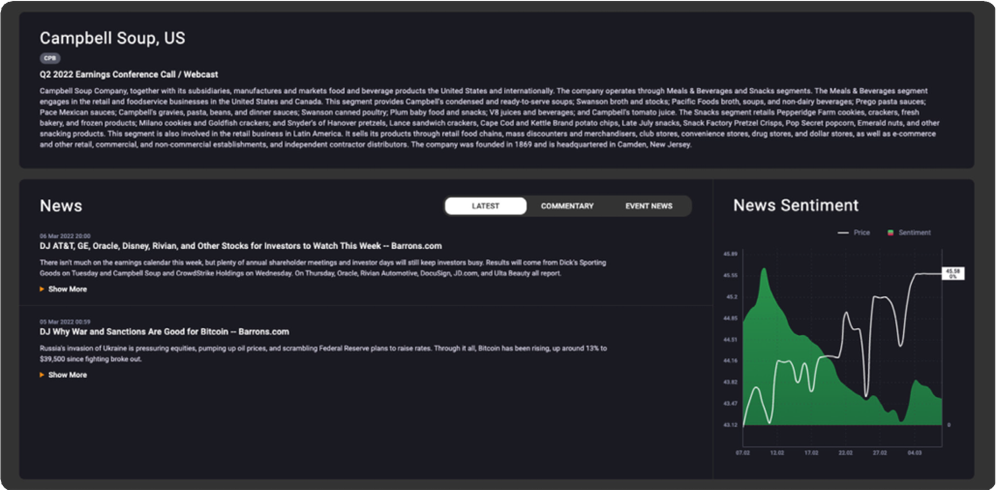
News and News Sentiment Chart
The news panel displays news from Dow Jones Newswires filtered by asset, industry and event. Coverage includes key economic news that affects the asset.
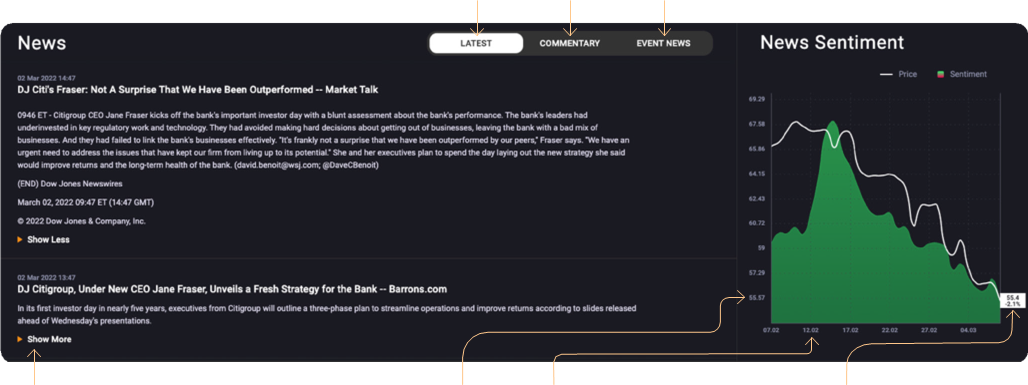
Click ‘Show More’ for the full story or ‘Show Less’ to close the story.
Select ‘Latest’ for all the latest news relating to the asset.
‘Commentary’ gives you the ‘why’ behind the market moves; offering insightful view points from key market participants or trade ideas and analysis from experienced market analysts.
Select ‘Event News’ for specific news relating to the selected calendar event.
Chart
This classic Acuity news sentiment chart displays news sentiment data correlated with price data of the selected asset.
Use this chart to monitor the historical effects of news sentiment on the asset price to help anticipate market response to current news sentiment levels.
X Axis: Date.
Y Axis: Asset price.
Dividends View
The Dividend events include similar content as the Earnings events but excludes the Earnings history and Earnings Surprise and Earnings Range data as Earnings have a greater impact on market movement than dividends.
Calls / Webcasts View
Calls / Webcasts events highlight the basic information required to trade on these events. Use the news and news sentiment data to understand how the market is currently feeling towards the asset in the lead up to an event.
Stock Splits View
Stock Split events are less frequent compared Earnings and Dividends for example. The brief description of the event and the expected investment is included. Use the news and News Sentiment data to monitor for movement in share price in the lead up to and after the event.
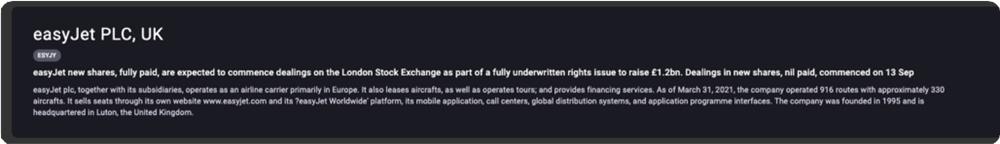
IPO & M&A View
Announcements of new stock issuance by a company or consolidation of companies and/or assets via a corporate action.
If you haven't found what you're looking for yet, don't worry! Our team is here to assist you.