Video Guide
Written Guide
Filters
To find opportunities most relevant to you start by accessing the Filters option.
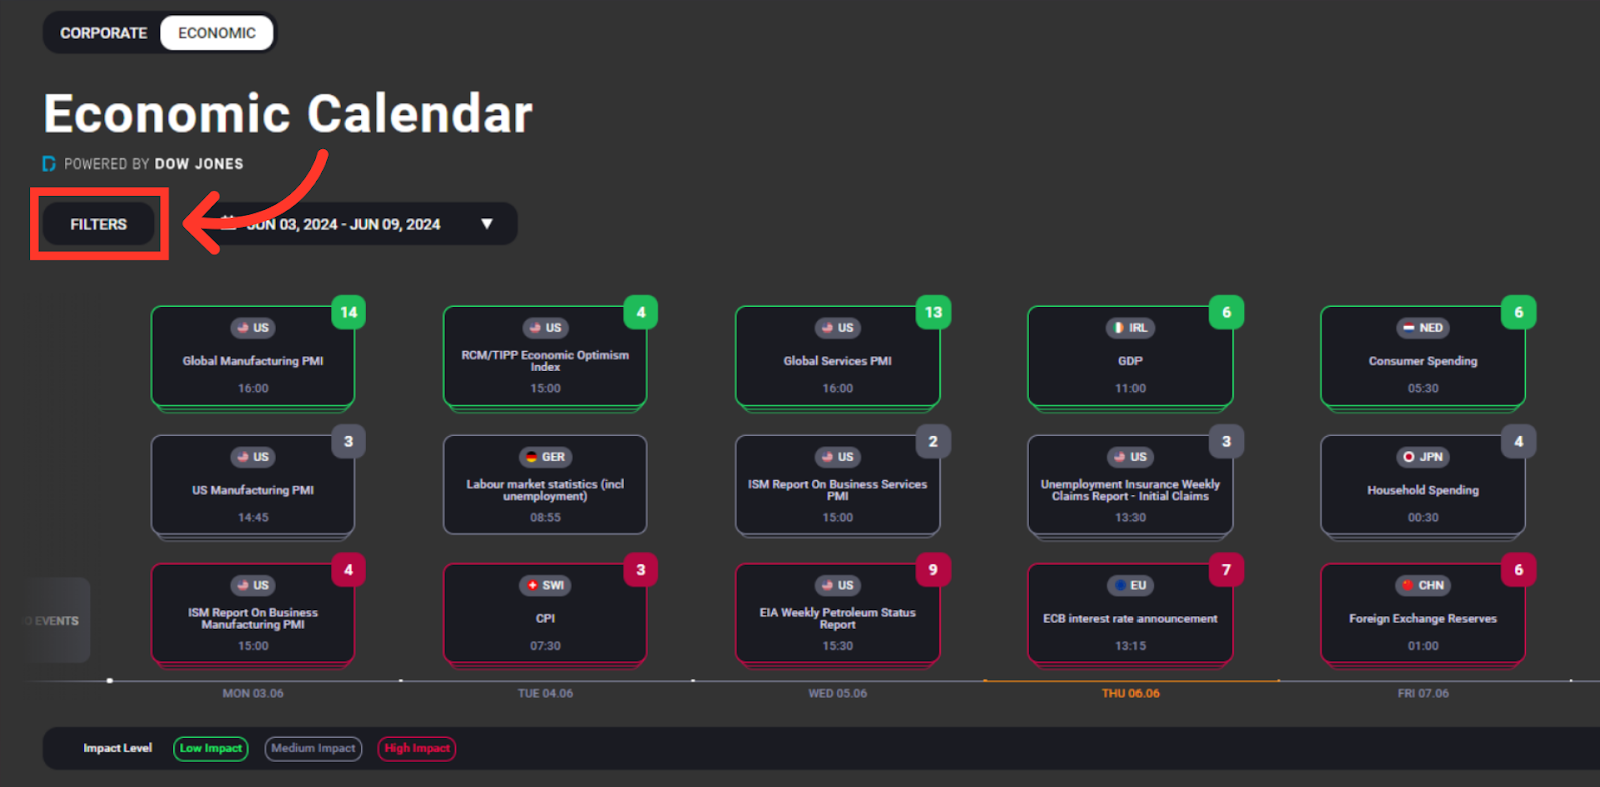
This feature offers a range of options, allowing you to personalize your experience and focus on the instruments that interest you the most.
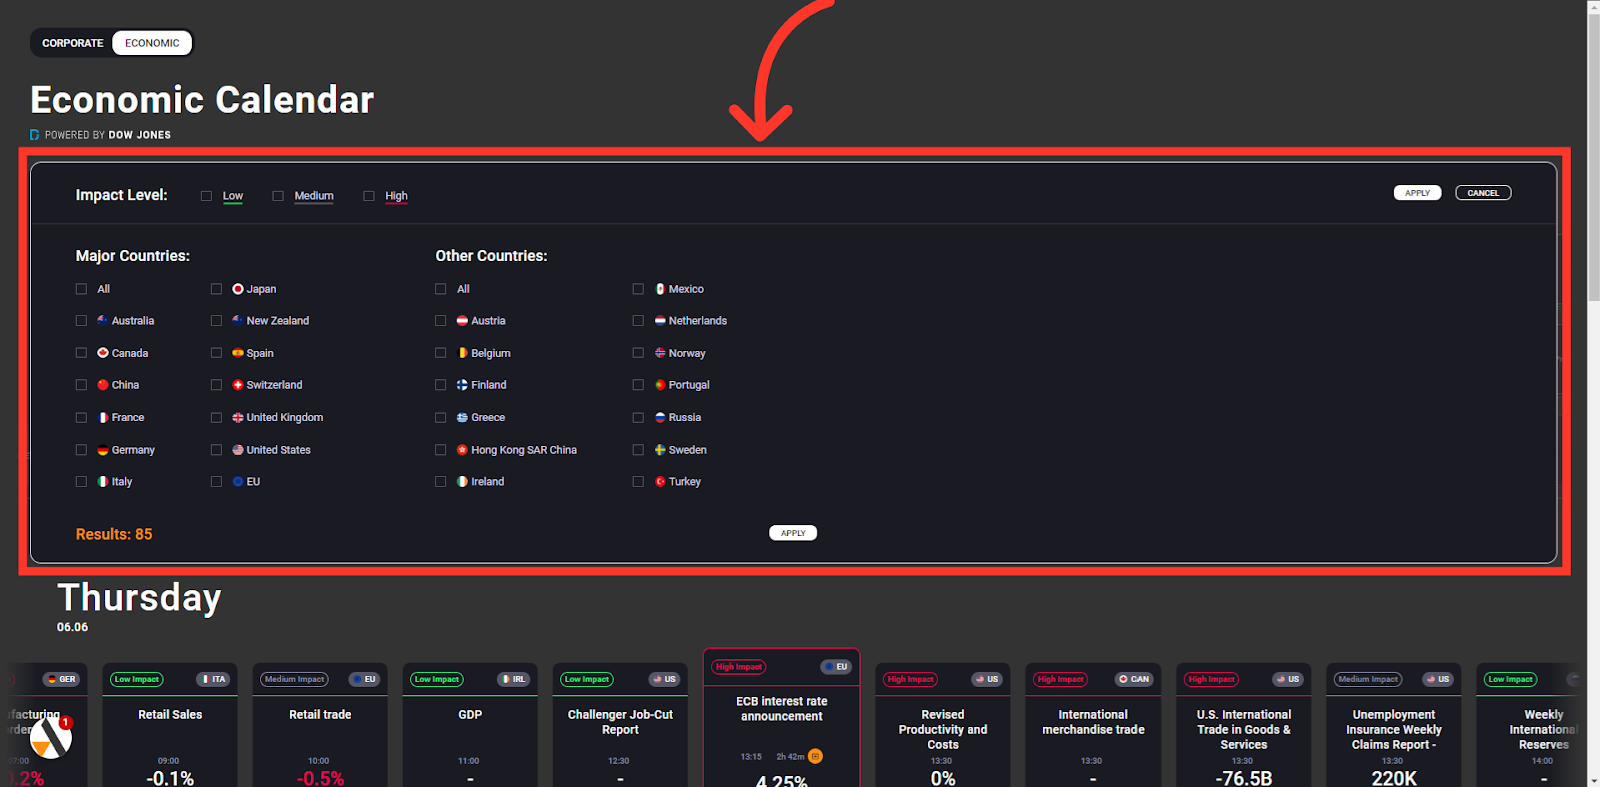
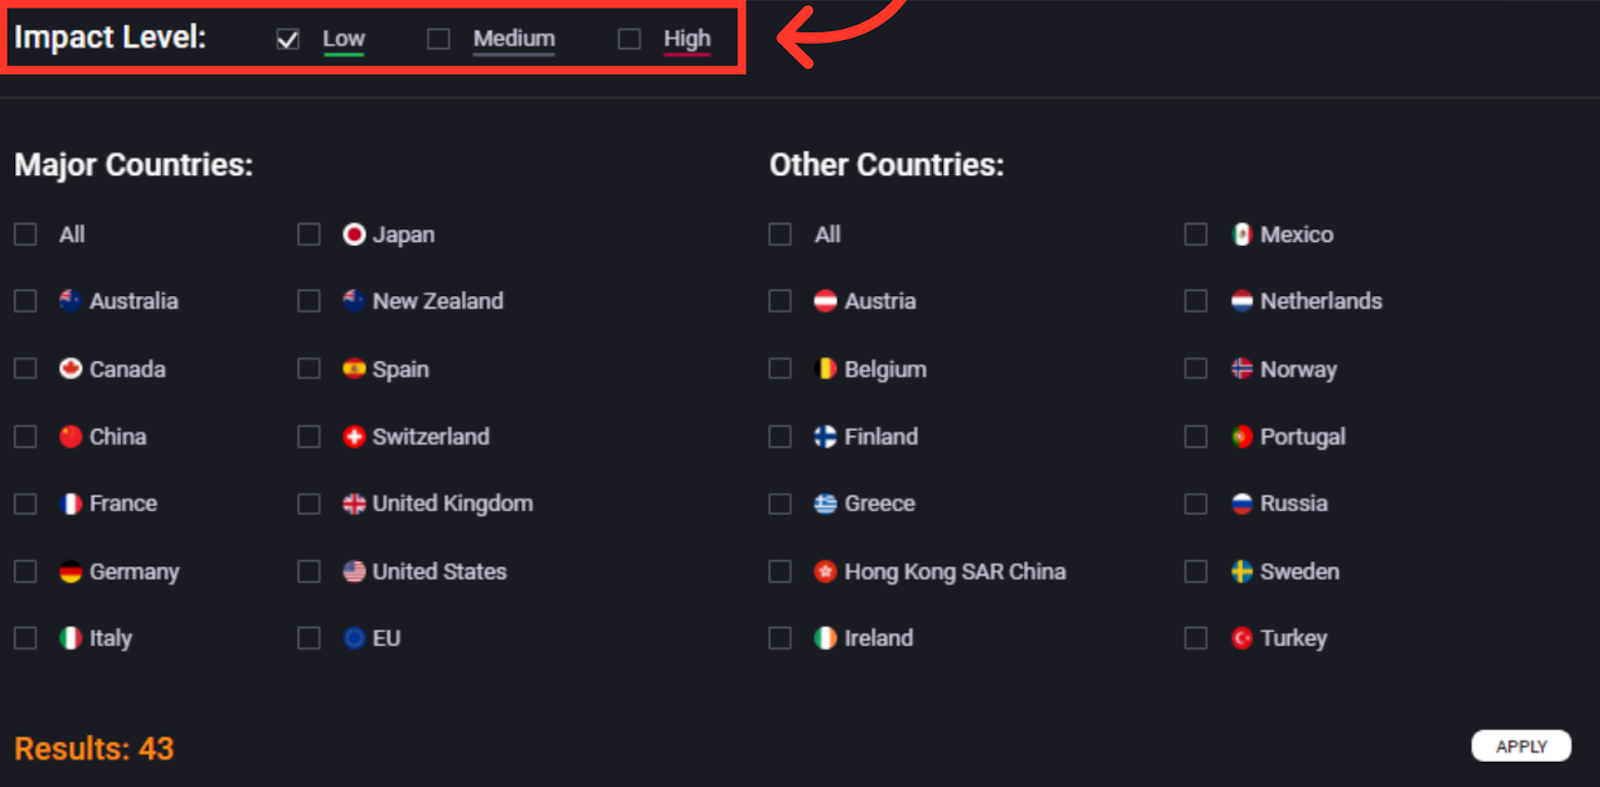
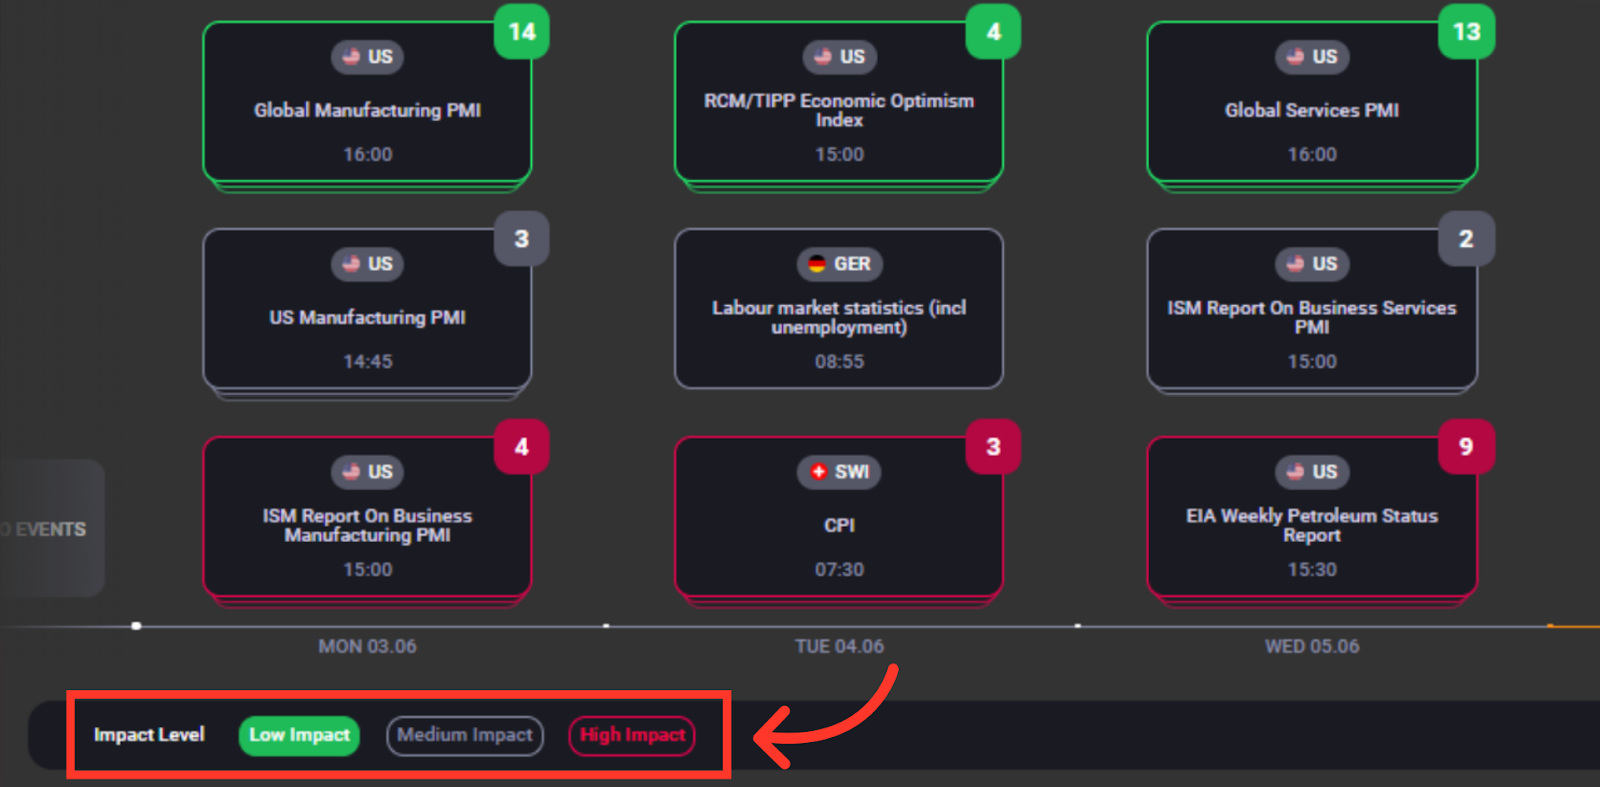
Impact Level
Filter by impact level to identify the events most likely to create volatility
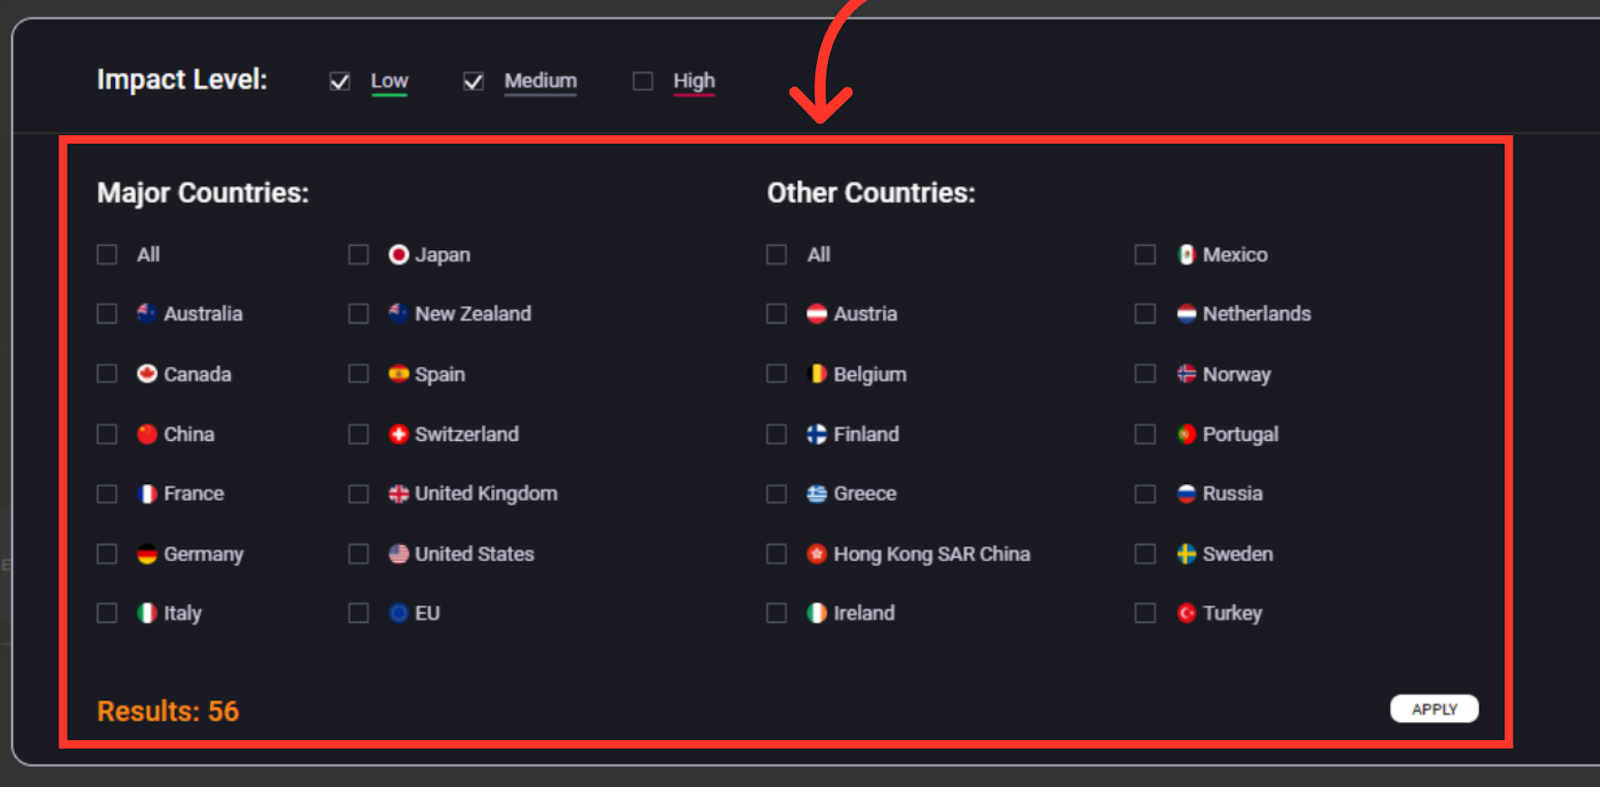
Countries
Or filter by country to find events relevant to your preferred markets.
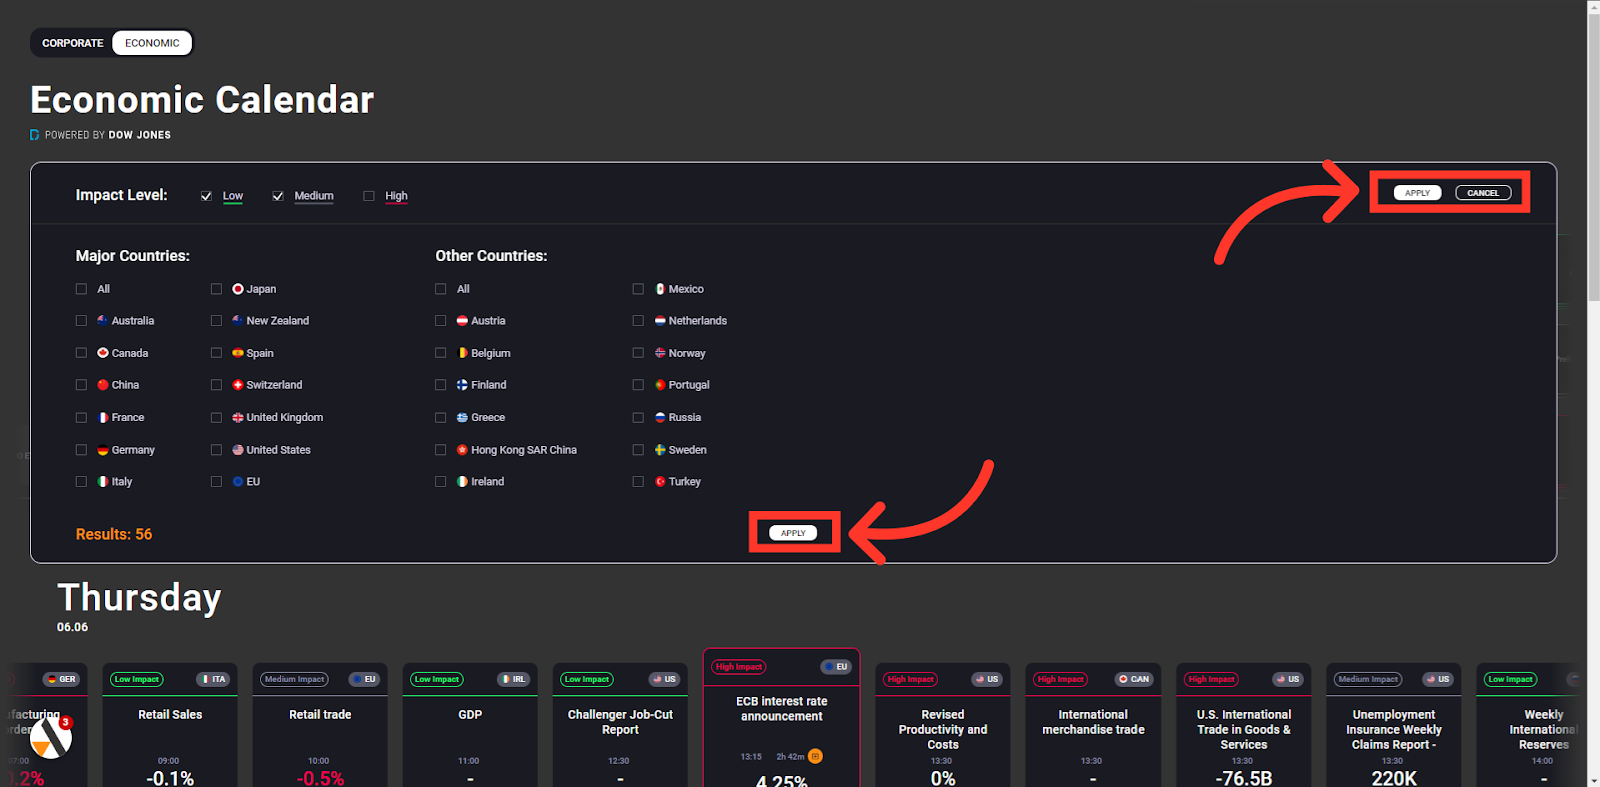
Apply Settings
Apply your settings to reveal the specific results you've requested.
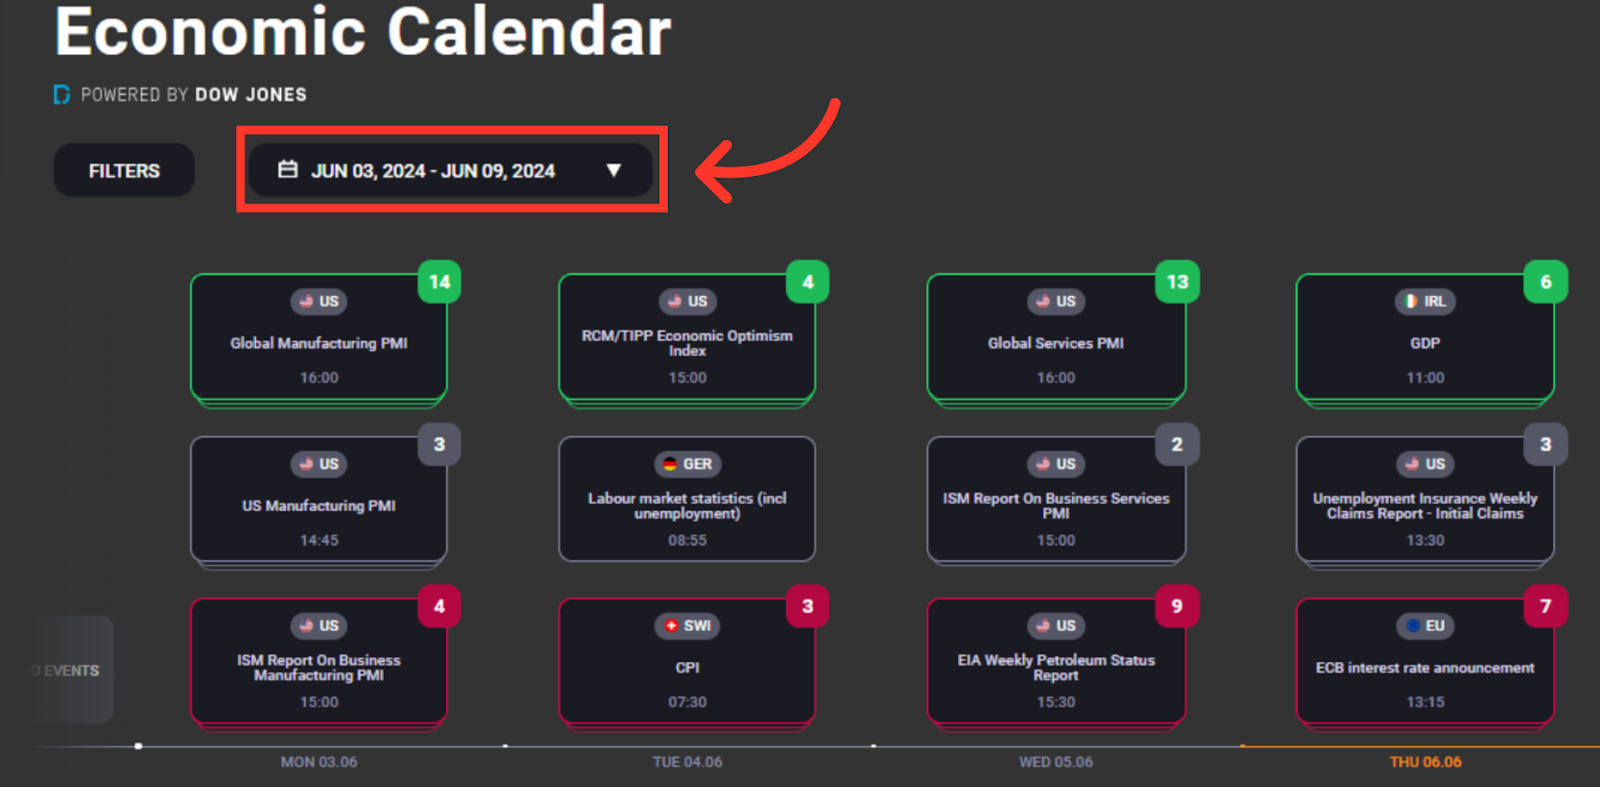
Date Filter
Use the date filter to gain advanced visibility of upcoming or previous economic events, helping you stay ahead with your trades.
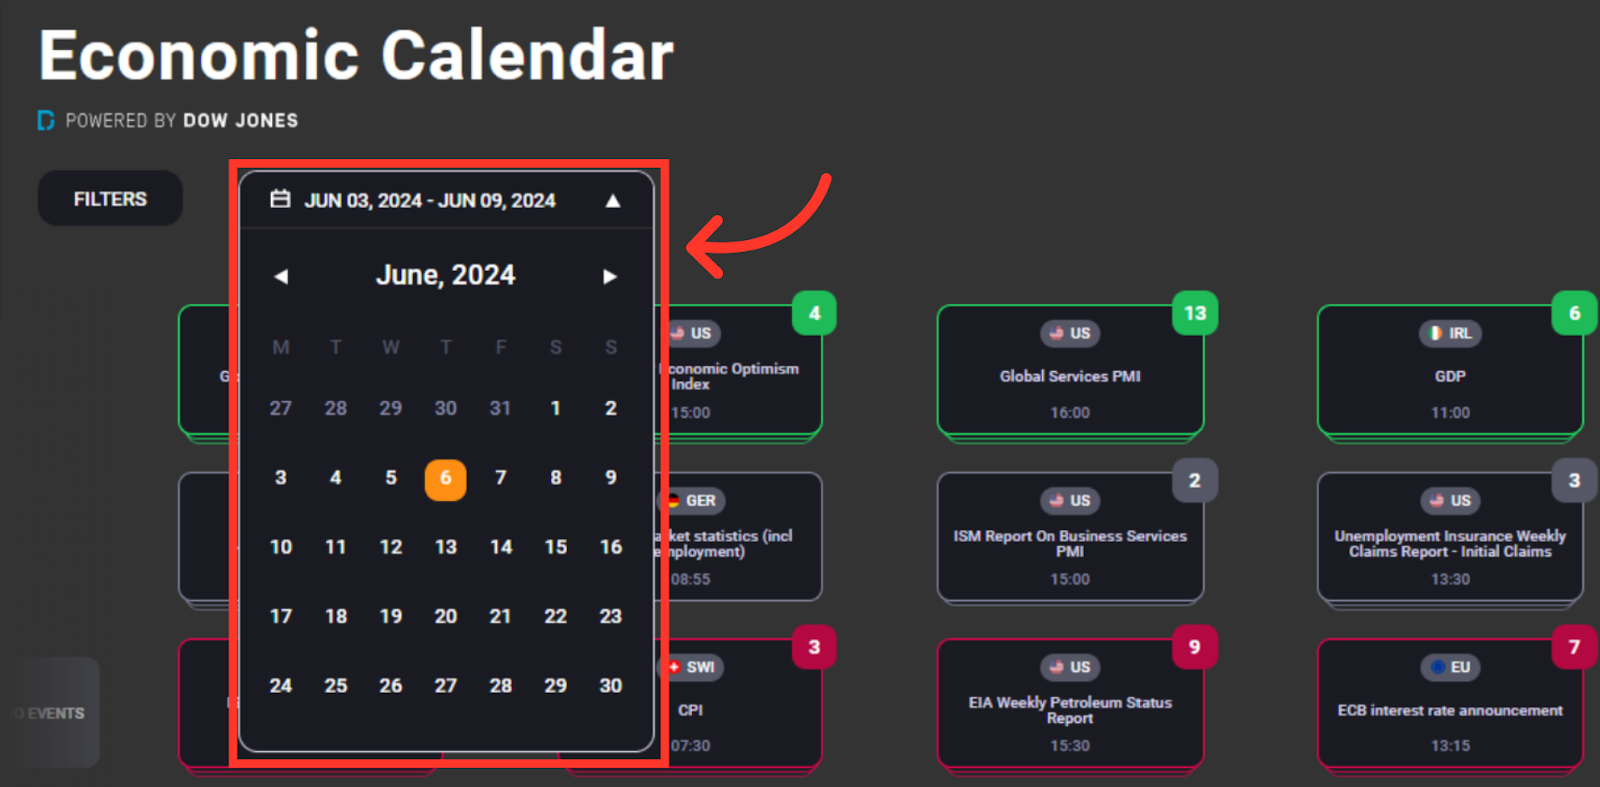
Date Picker
Select specific dates weeks in advance using the date picker
Quick Filter
Quickly find the most impactful events by using the quick filter options and selecting the impact level.
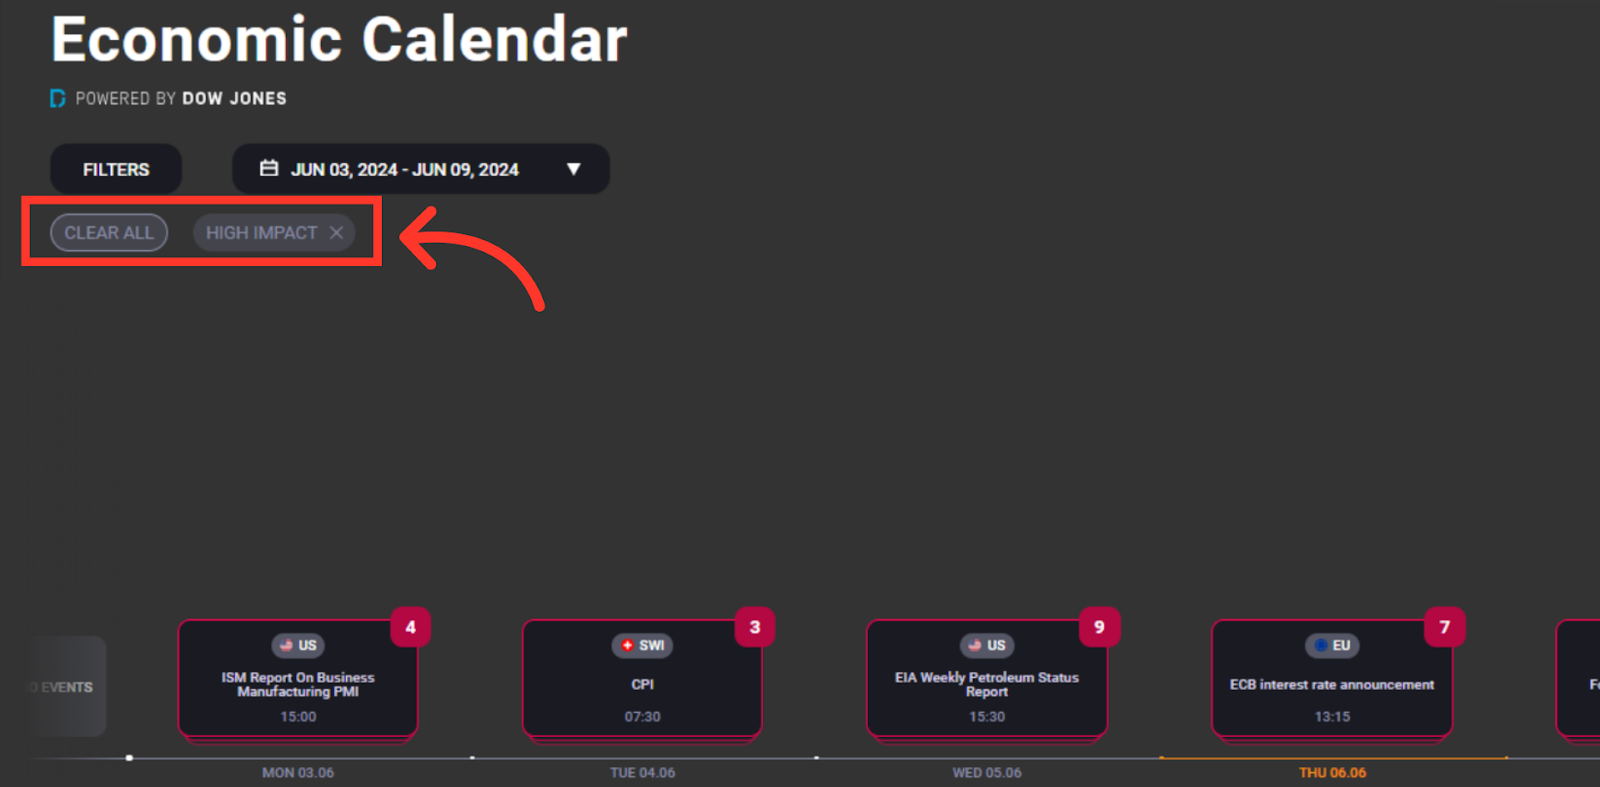
Clear Filters
Your filtered options will be displayed here. You can also reset the filters using the 'Clear All' button.
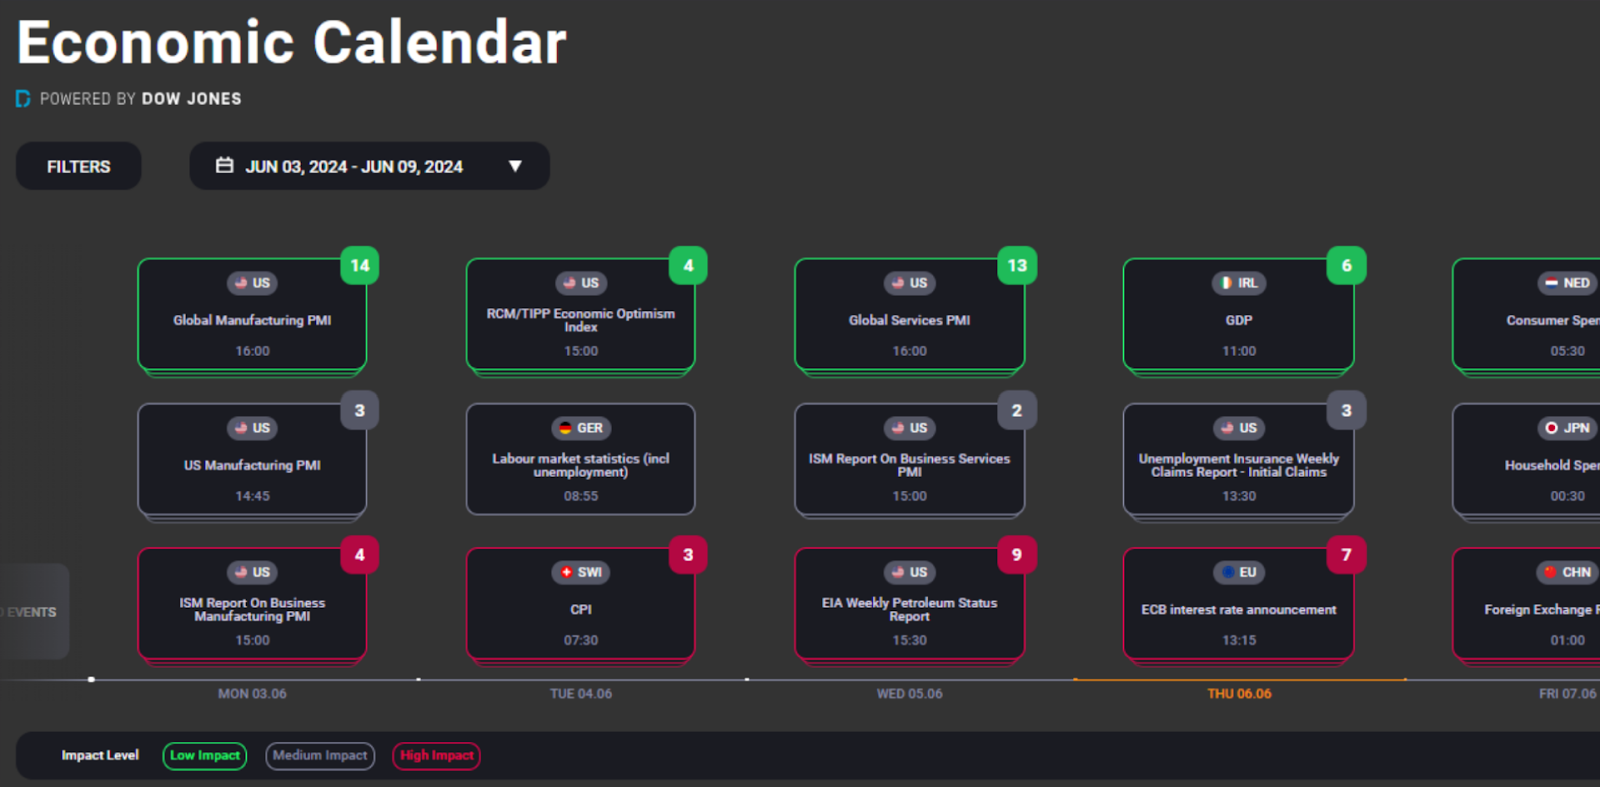
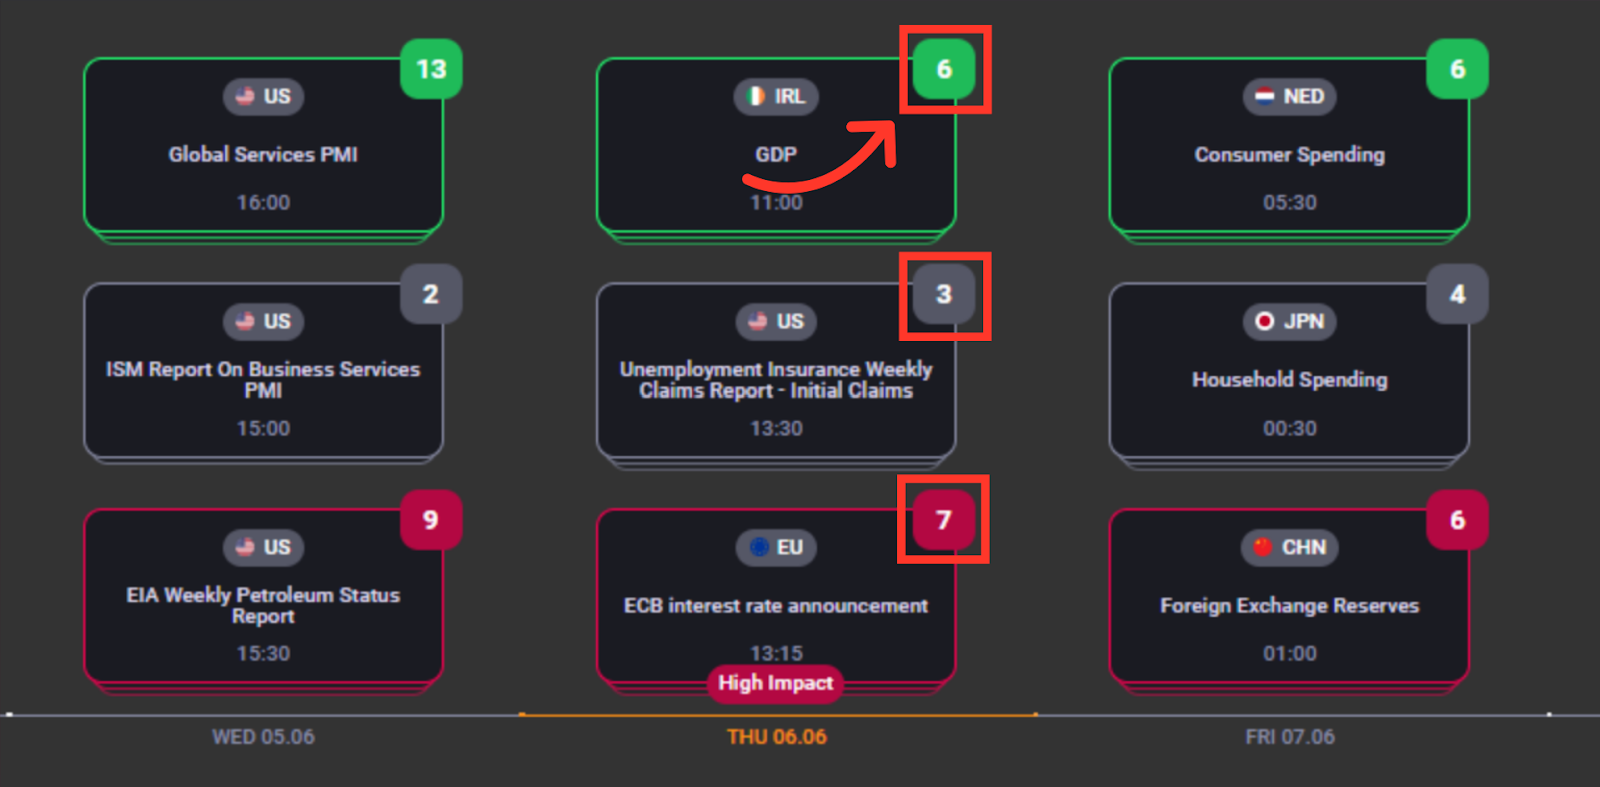
Number of events
Each trading day will display tiles with a number in the right-hand corner, indicating the number of events scheduled for release today based on their impact level.
Data Tile
Each tile displays all the key information for the upcoming event.
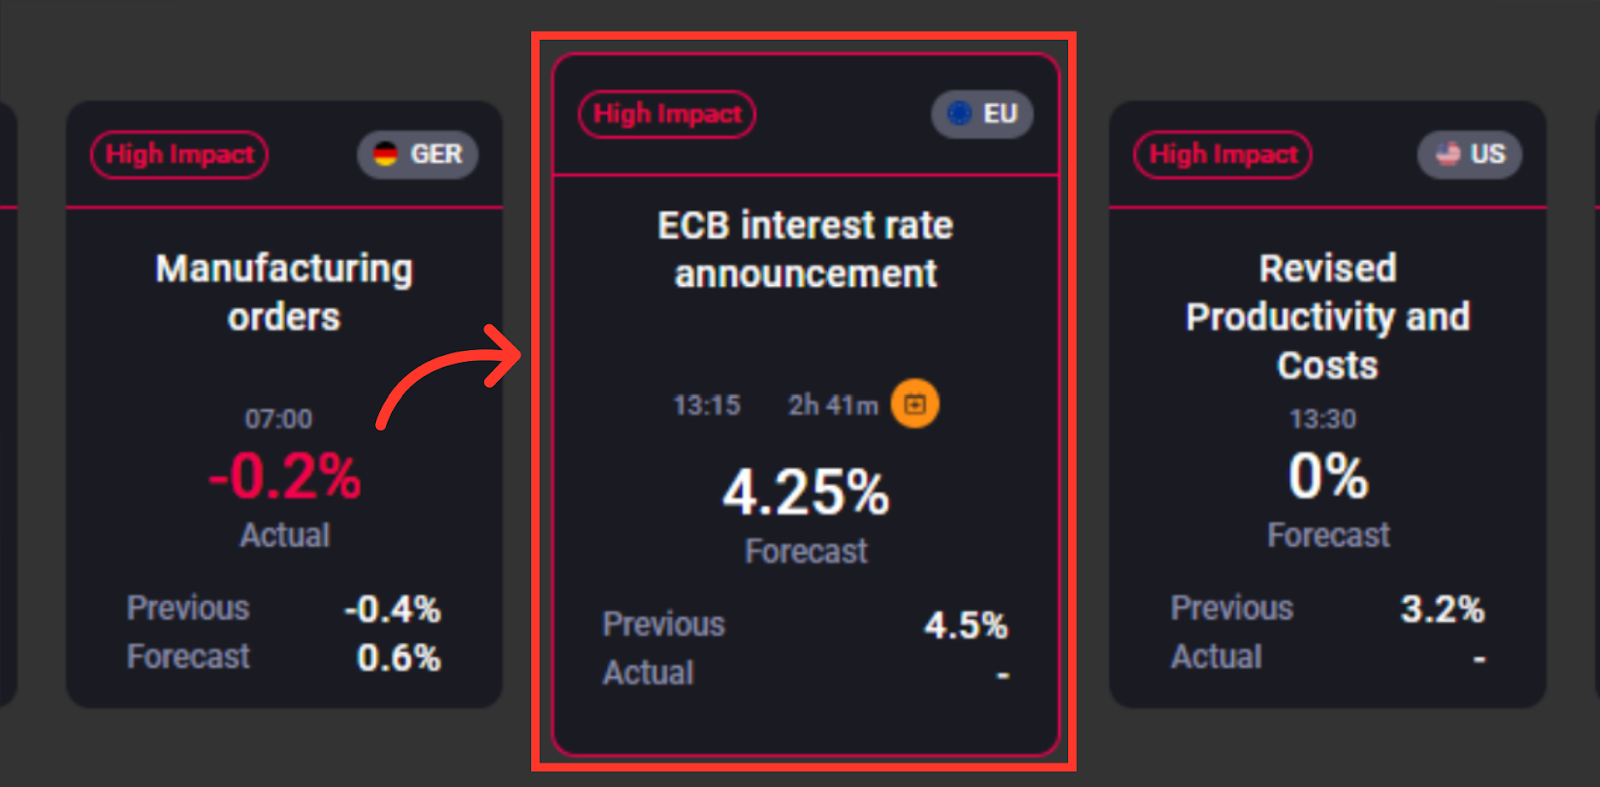
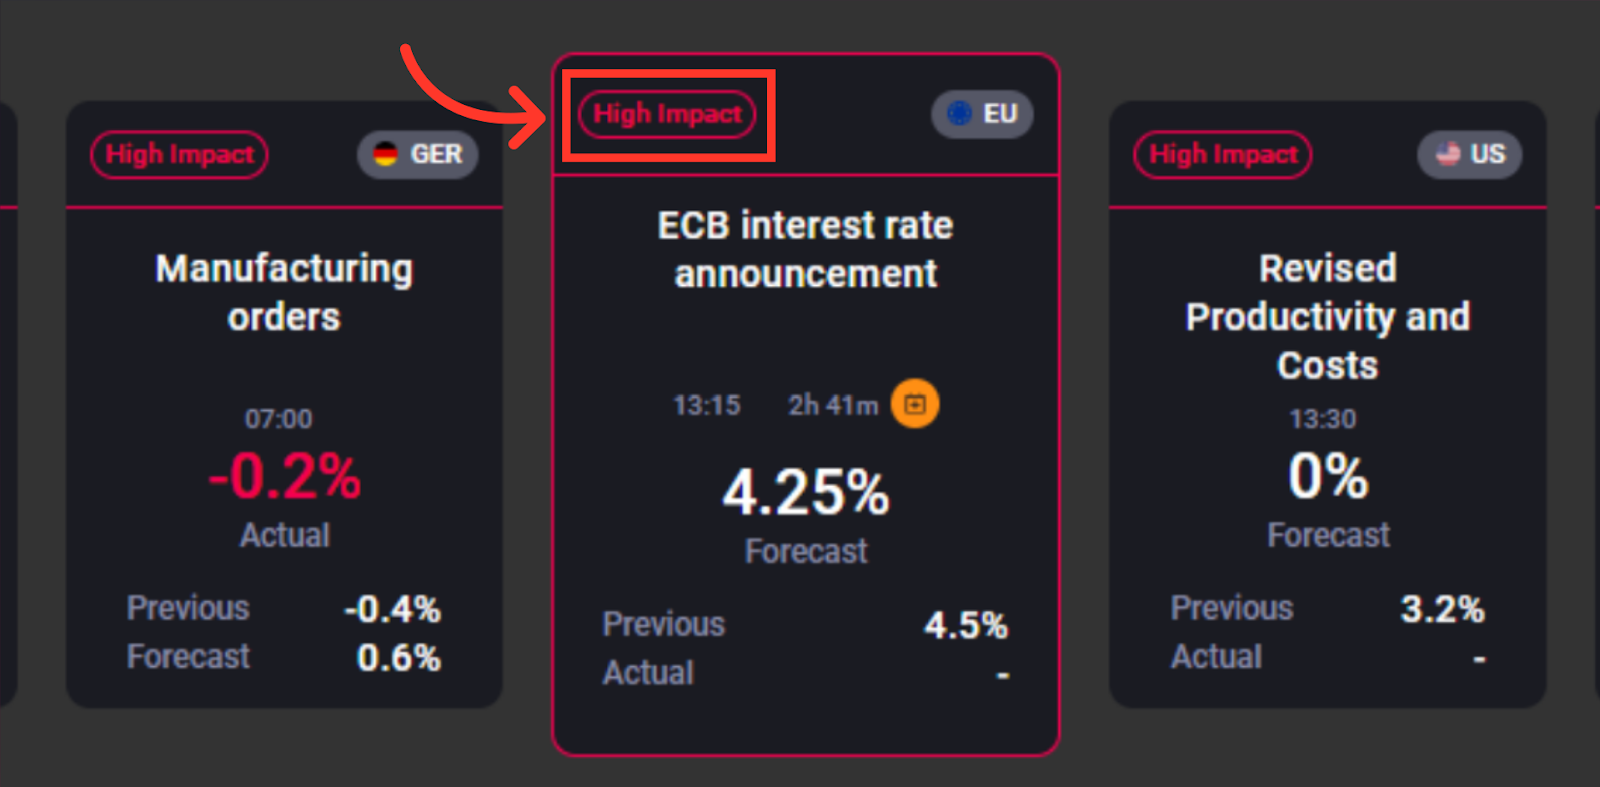
Impact level
This includes the impact level, which is also represented by its corresponding colour.
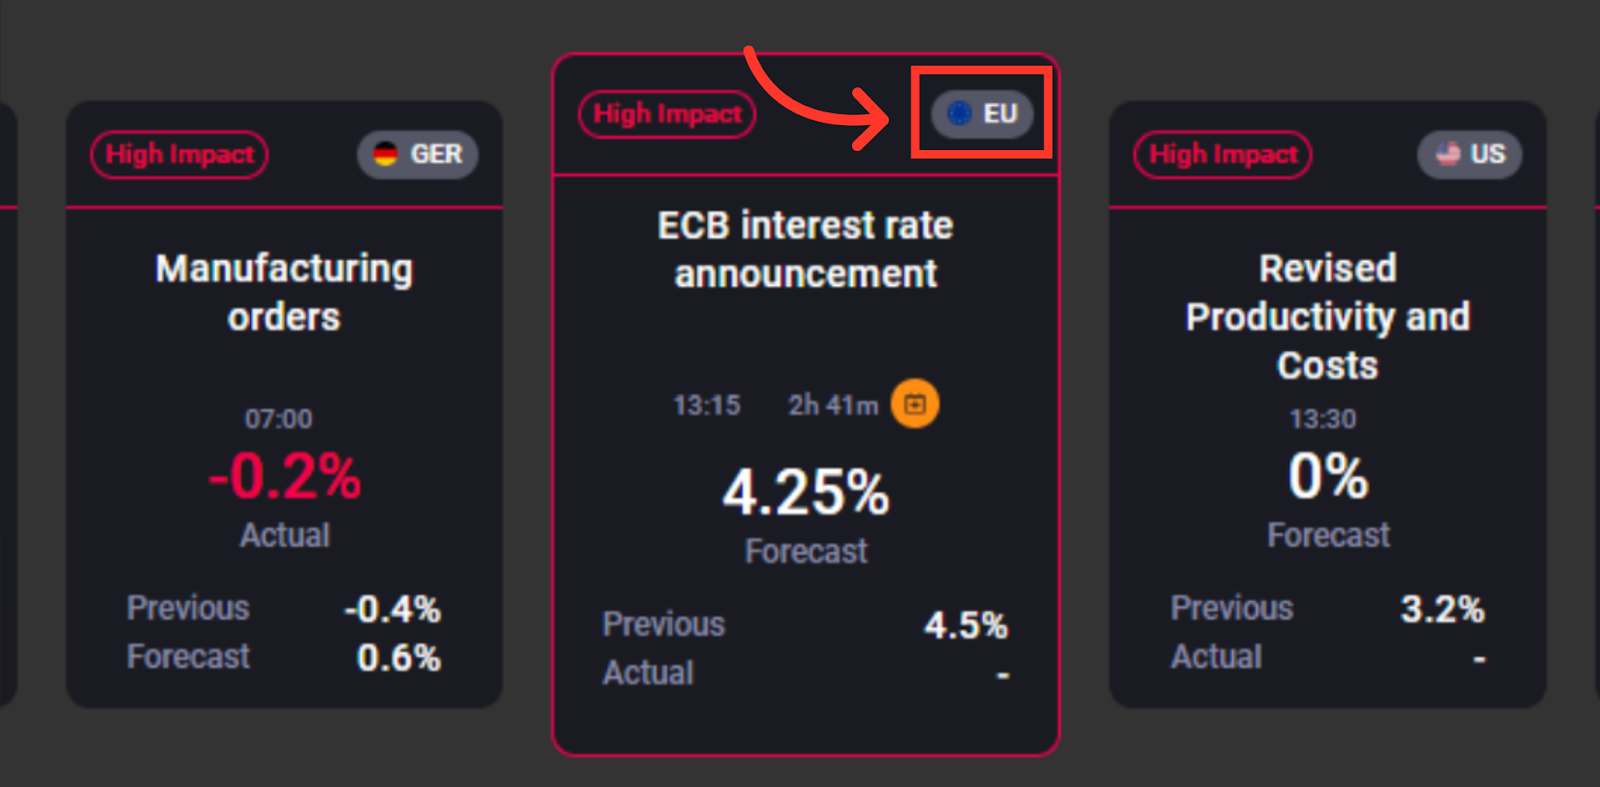
Country
The relevant country
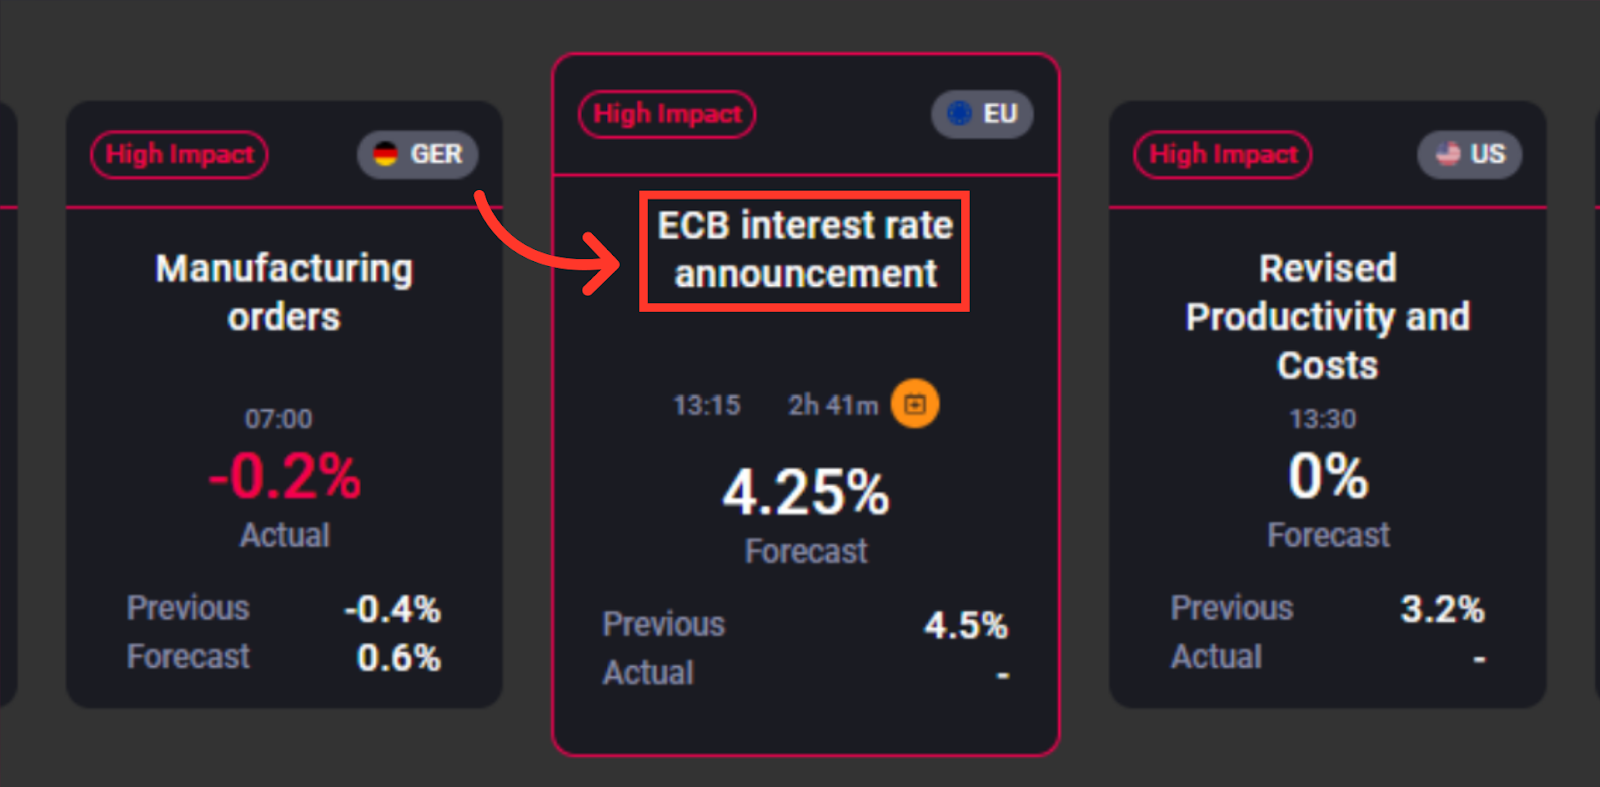
Event
The name of the event
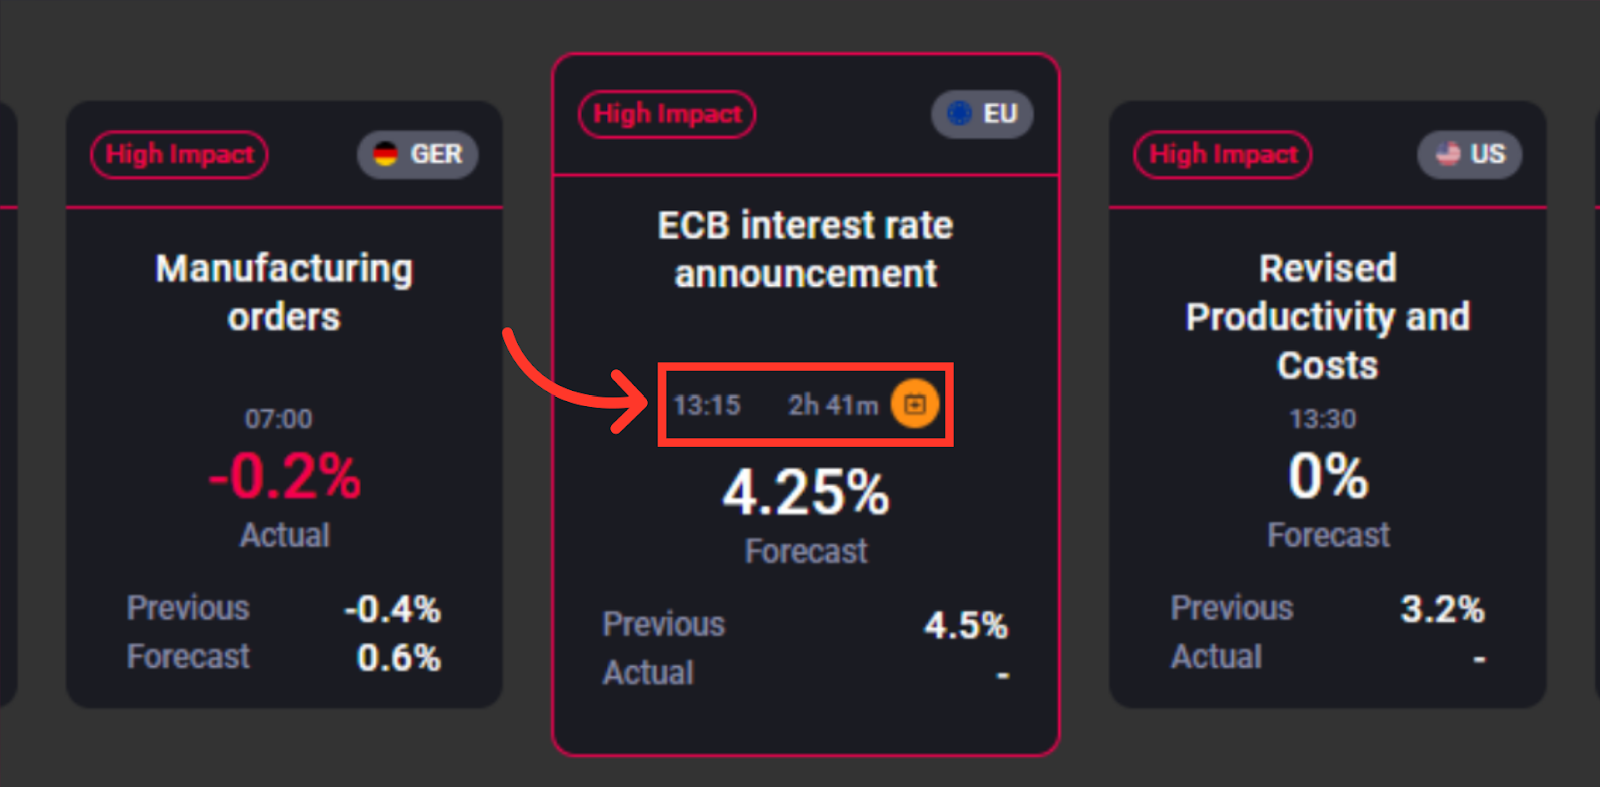
Time/Countdown
the time when the data is set to be released, along with a countdown timer to the event.
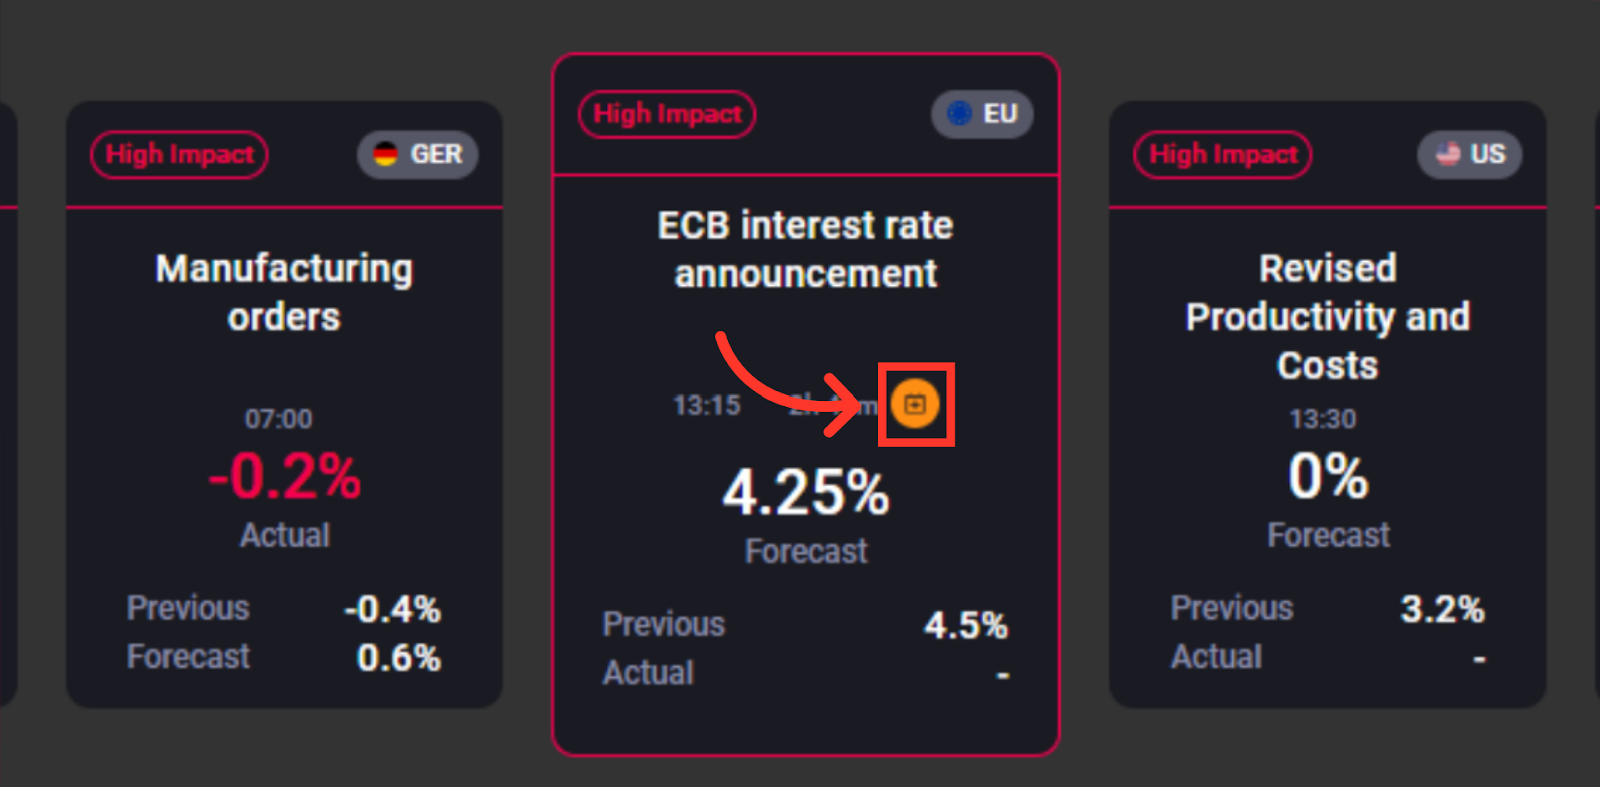
Calendar Link
a link is available to add these events to your own virtual calendar.
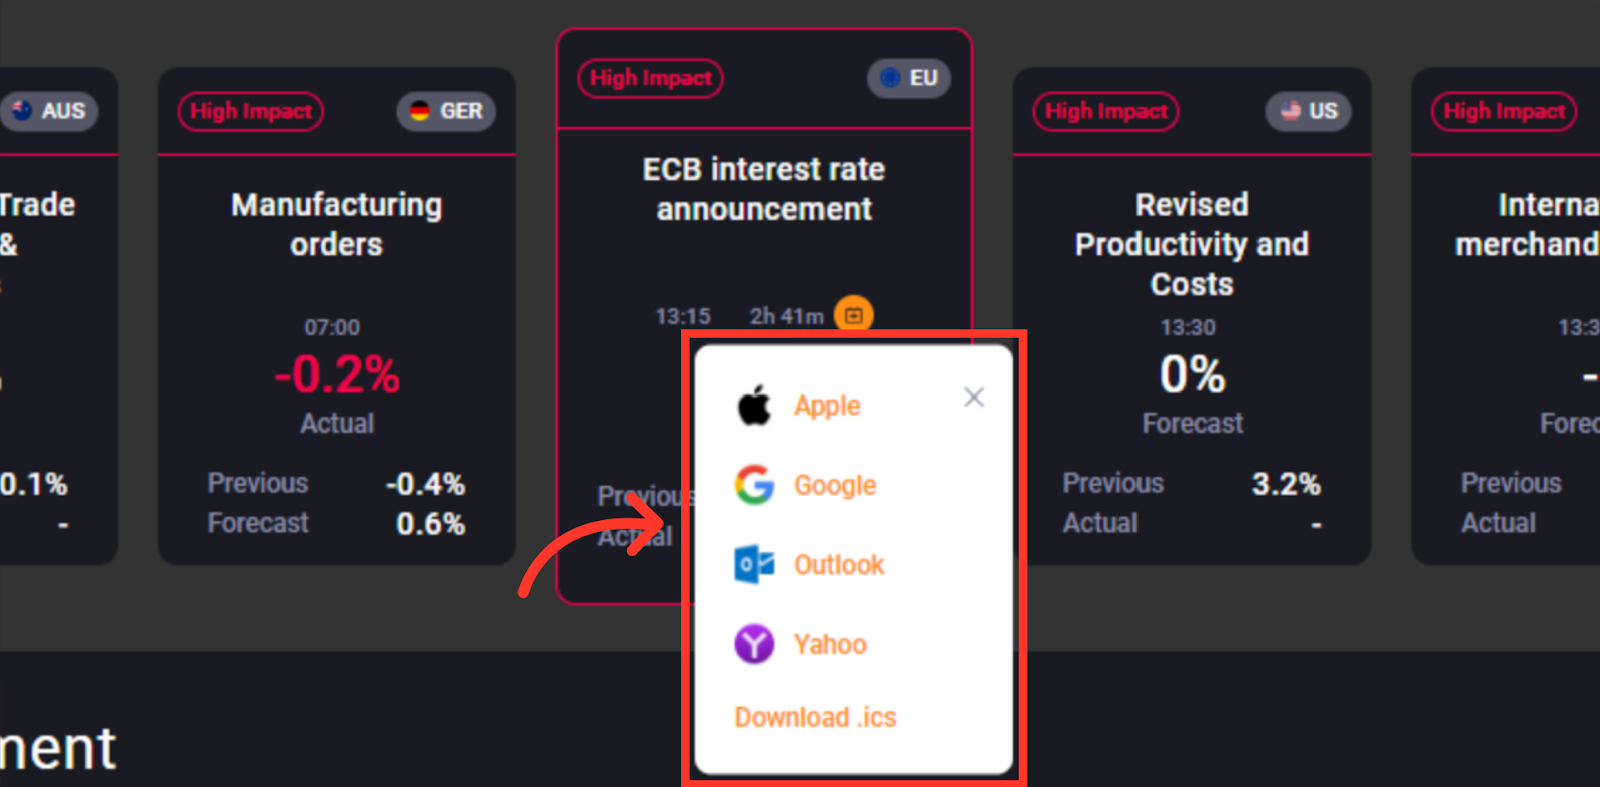
Select Calendar
This function seamlessly integrates with all major calendar tools, ensuring you never miss another event.
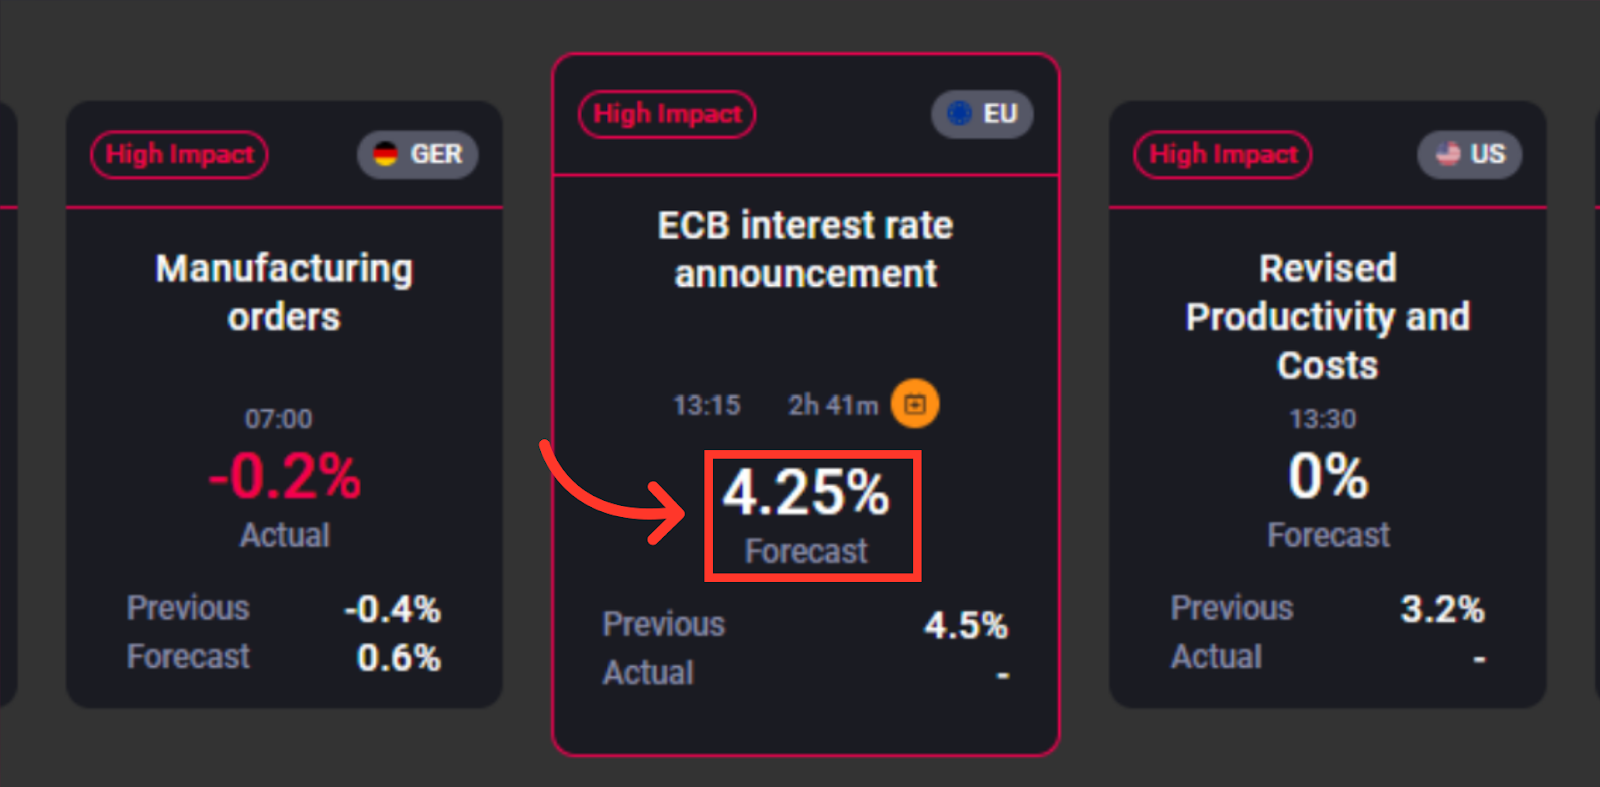
Forecast
We also provide the forecasted number of the event based on analysts' consensus.
Previous/Actual
as well as the previous data release.
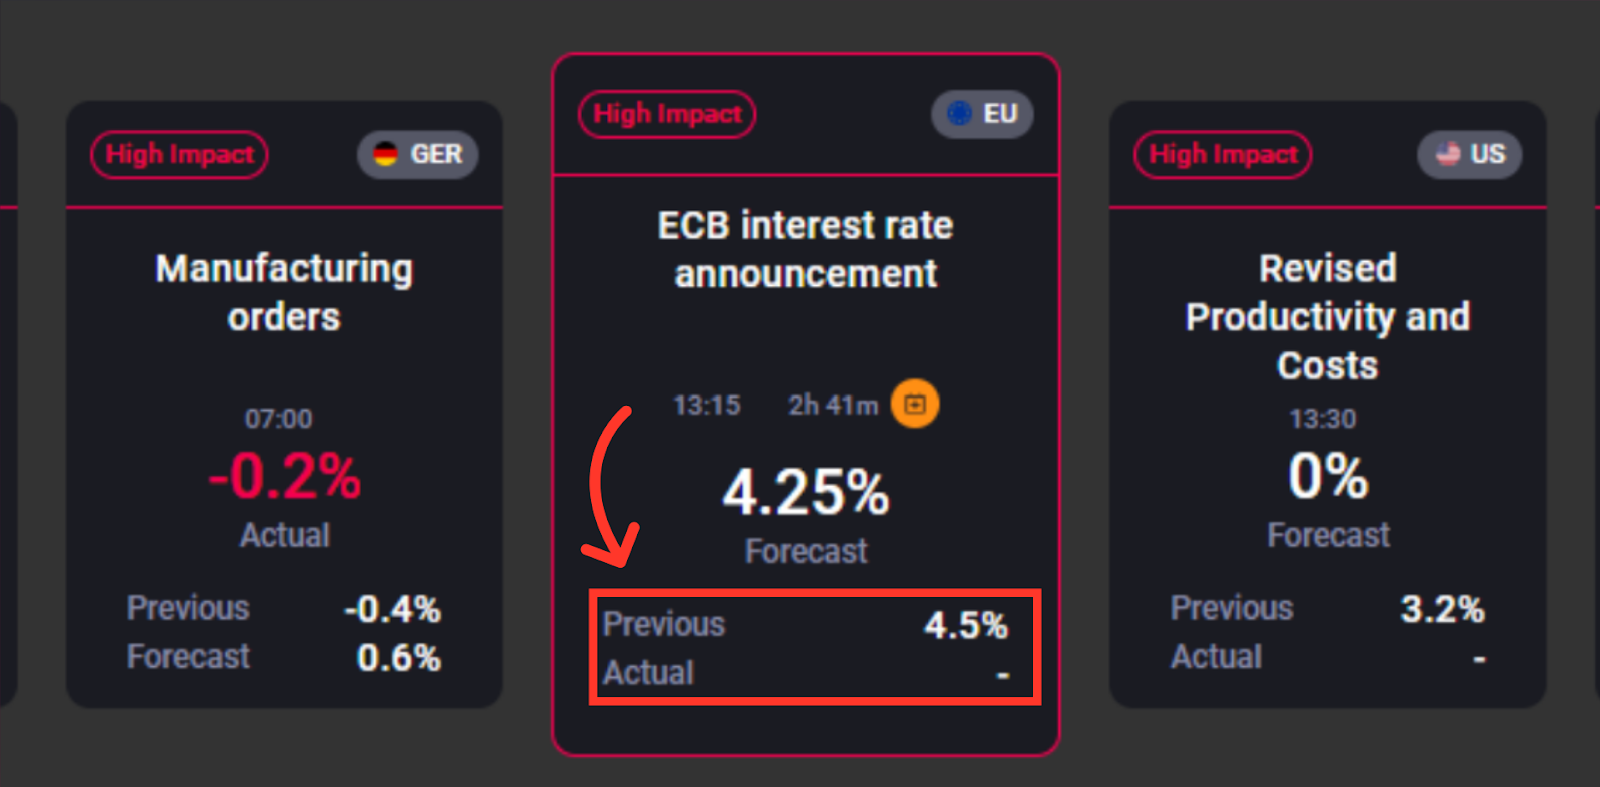
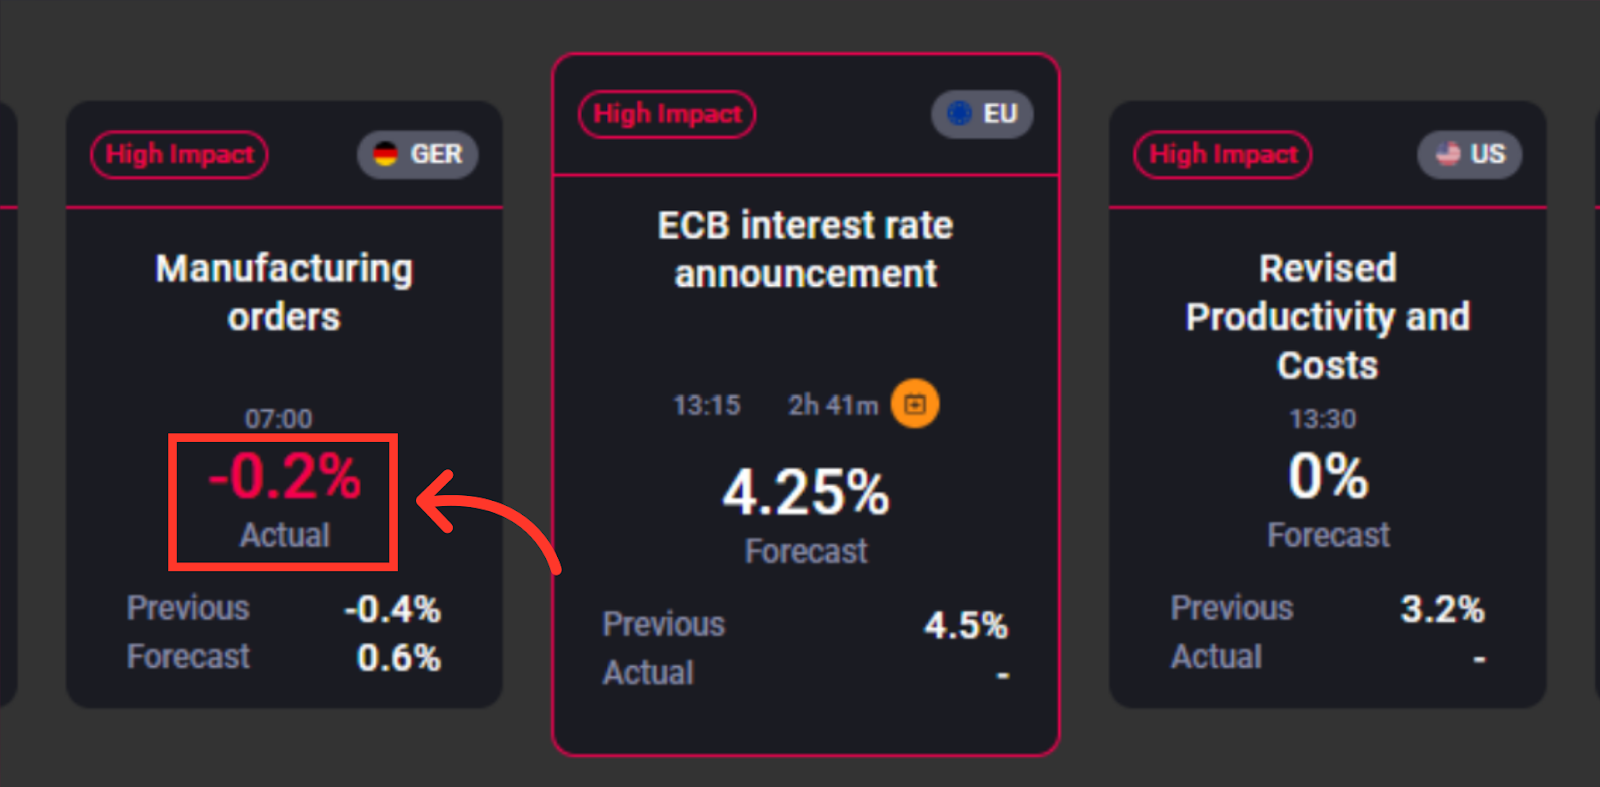
Actual
Events are updated in real-time. Once the data is released, it will be visible in the centre of the tile. A red number indicates the figure was worse than expected, while a green number indicates it was better than expected.
Event Description
Clicking on the tile will present traders with more details about the event.
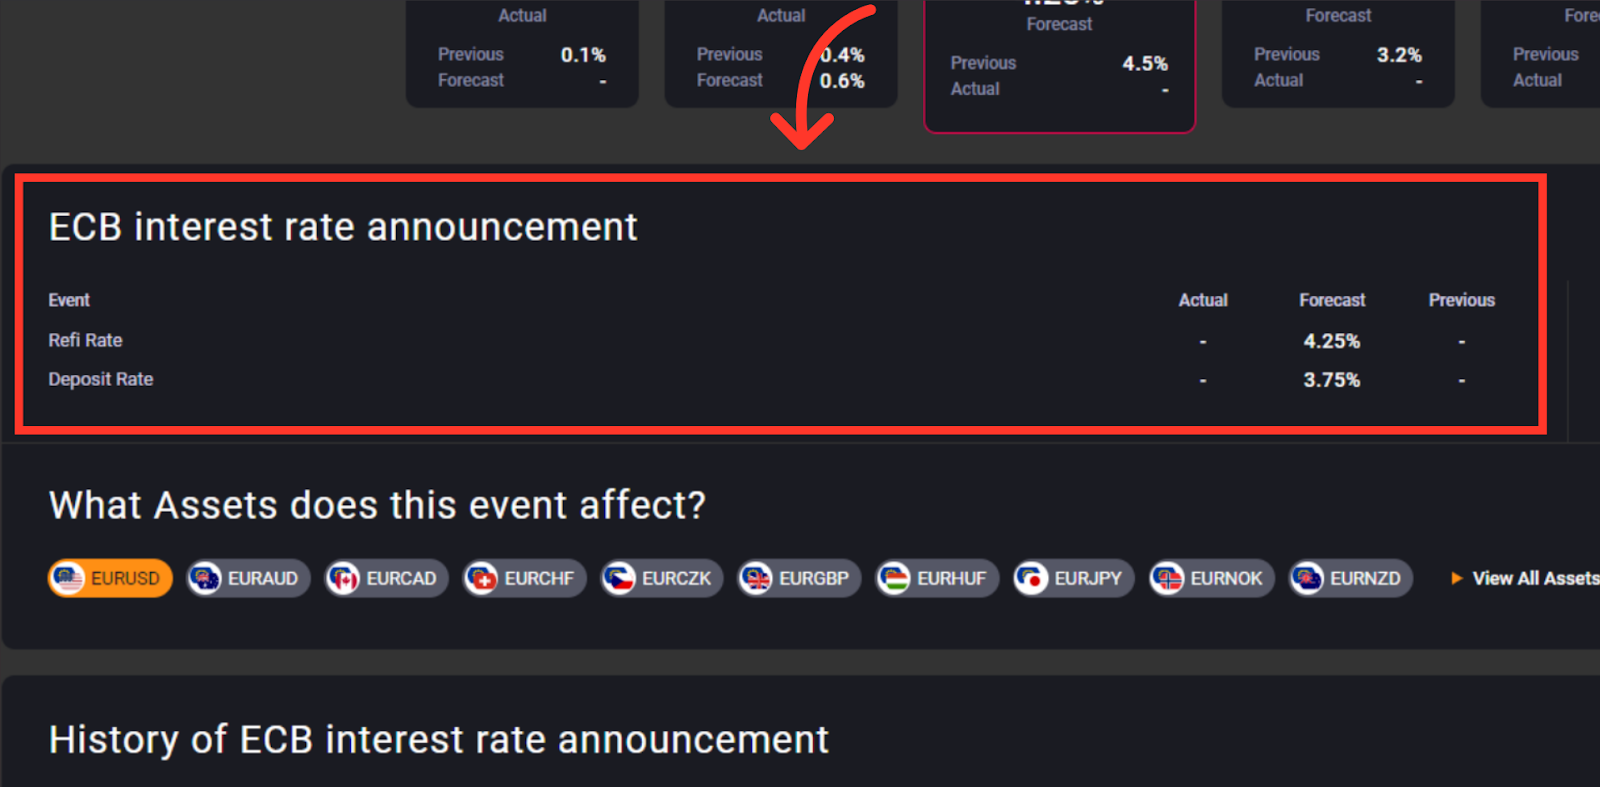
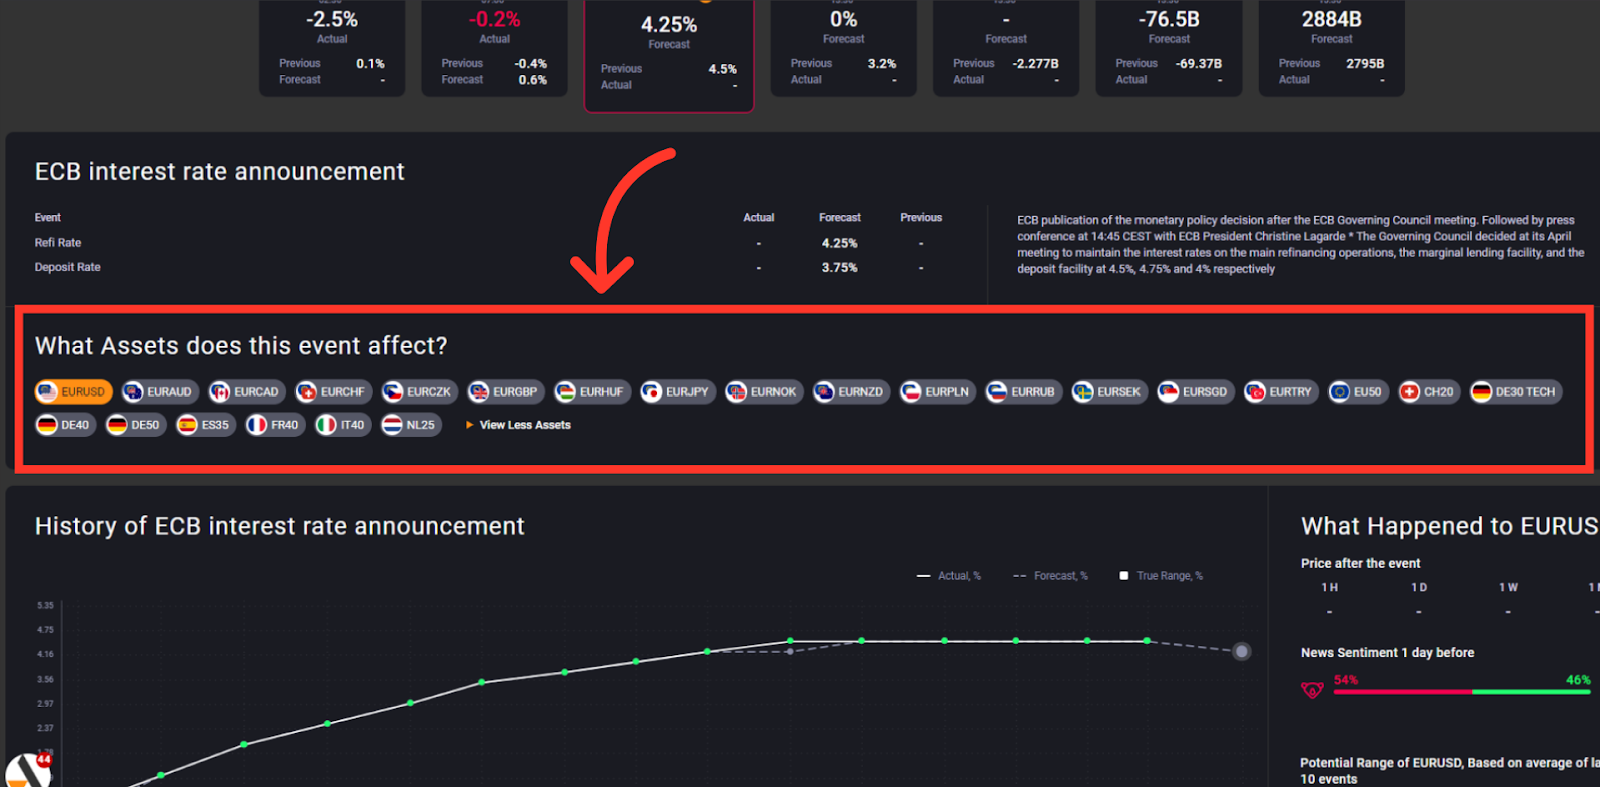
Linked Events
Associated events, along with the actual, forecasted, and previous data, will be displayed here
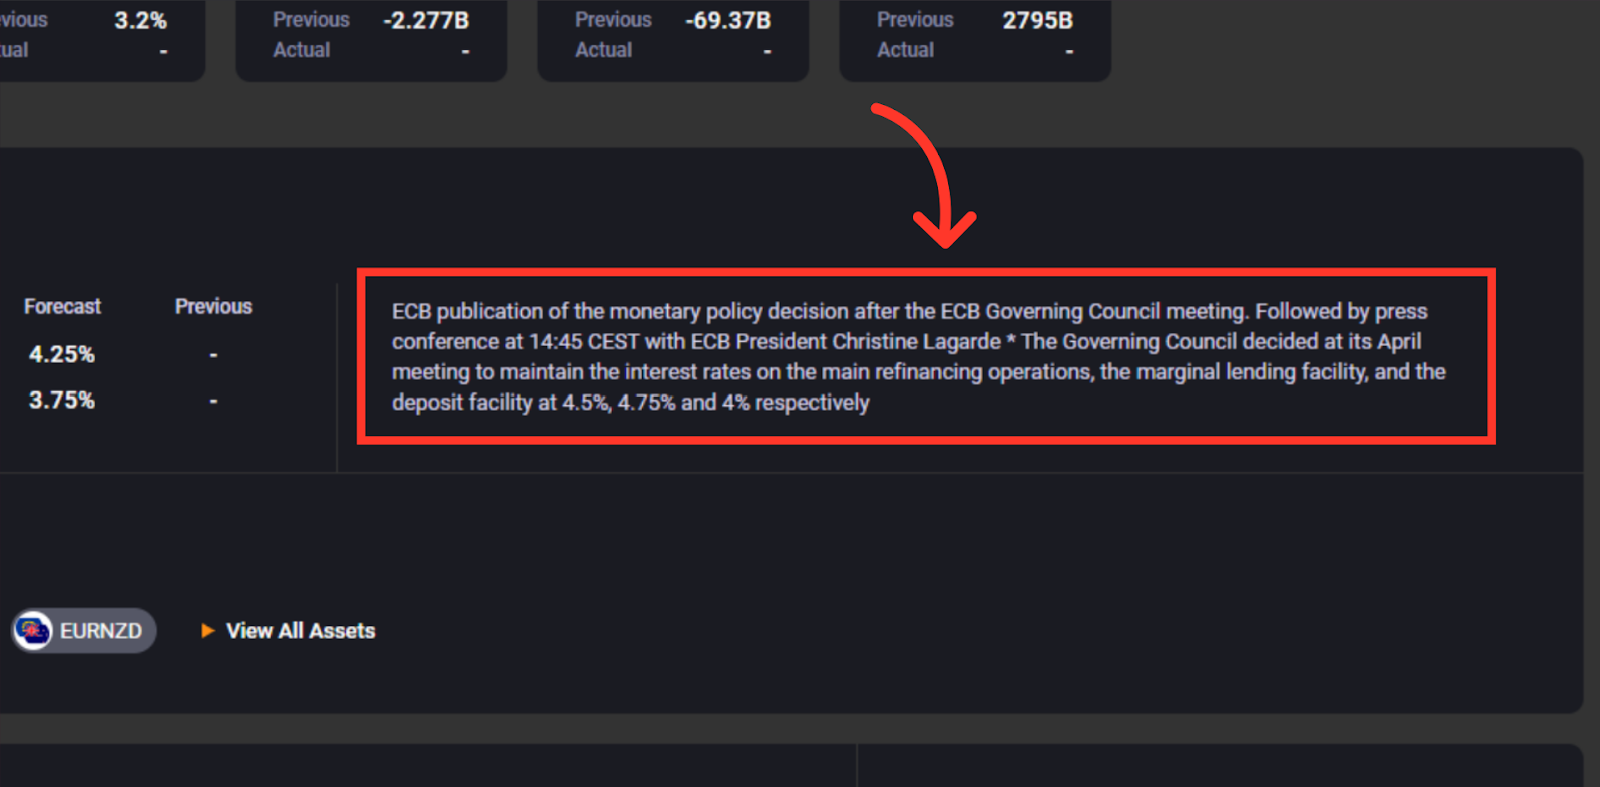
Event Description
We provide detailed descriptions of the event to ensure traders are fully informed about its significance, encouraging a deeper understanding of financial markets
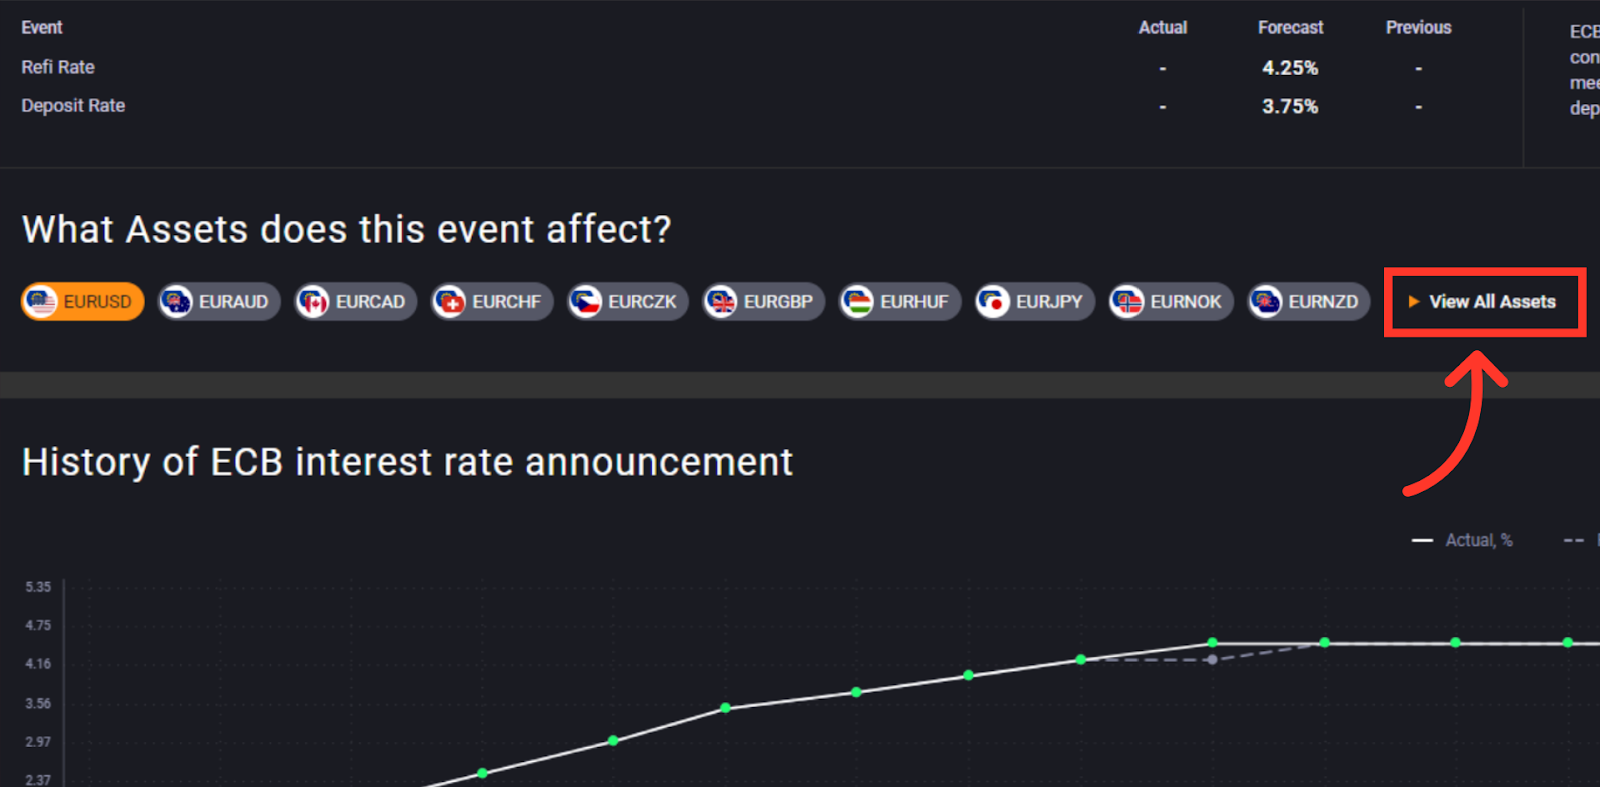
Affected Events
Easily visualize which of the most popular markets are likely to be impacted by the event
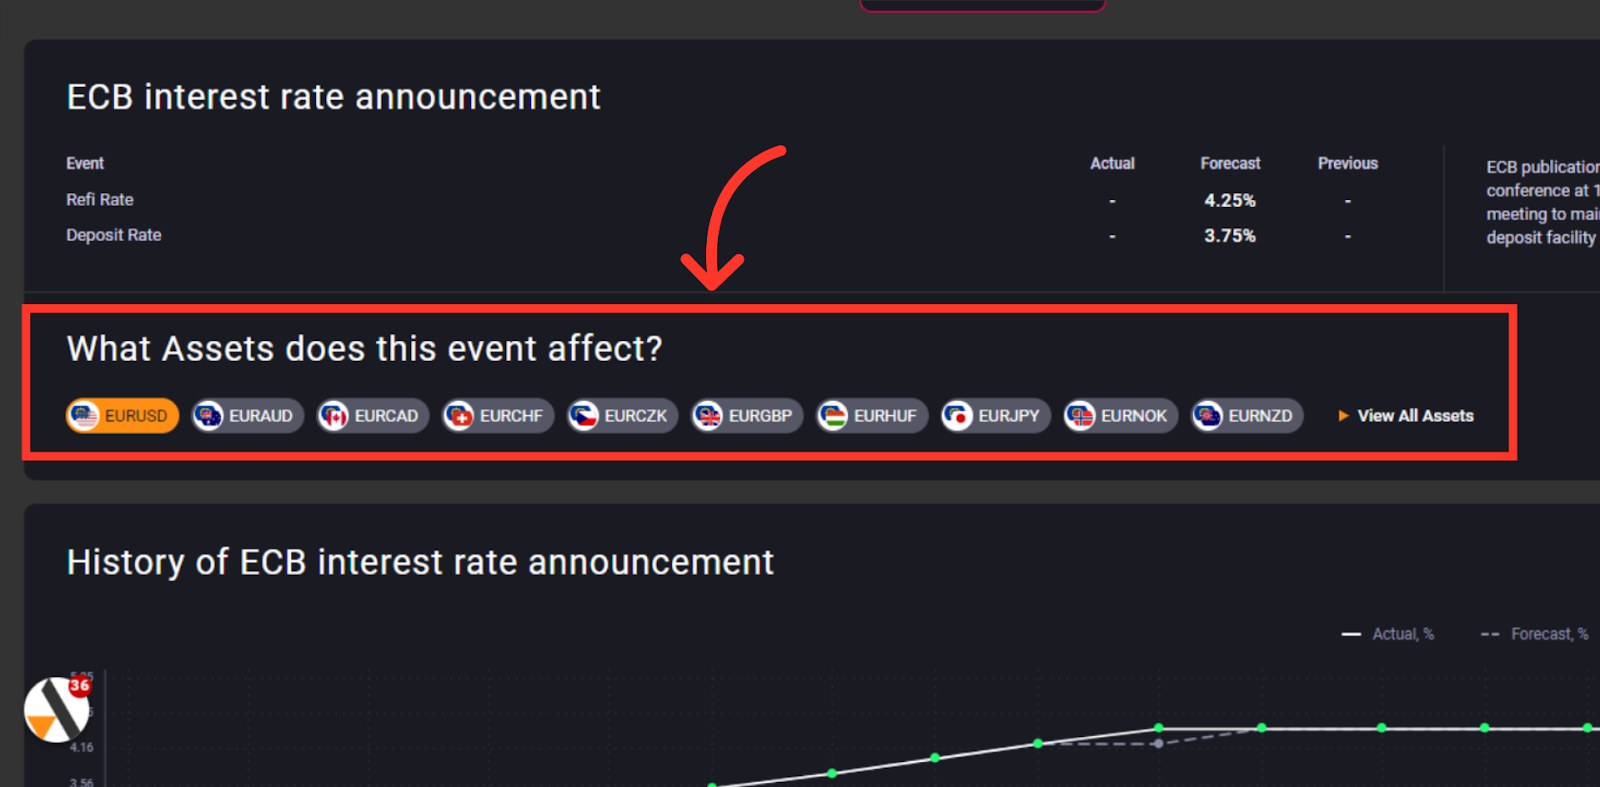
View All Assets
To discover all markets likely to be impacted by the event, click 'View All Assets'.
Full list of assets
Select from a comprehensive list to highlight the markets most important to you.
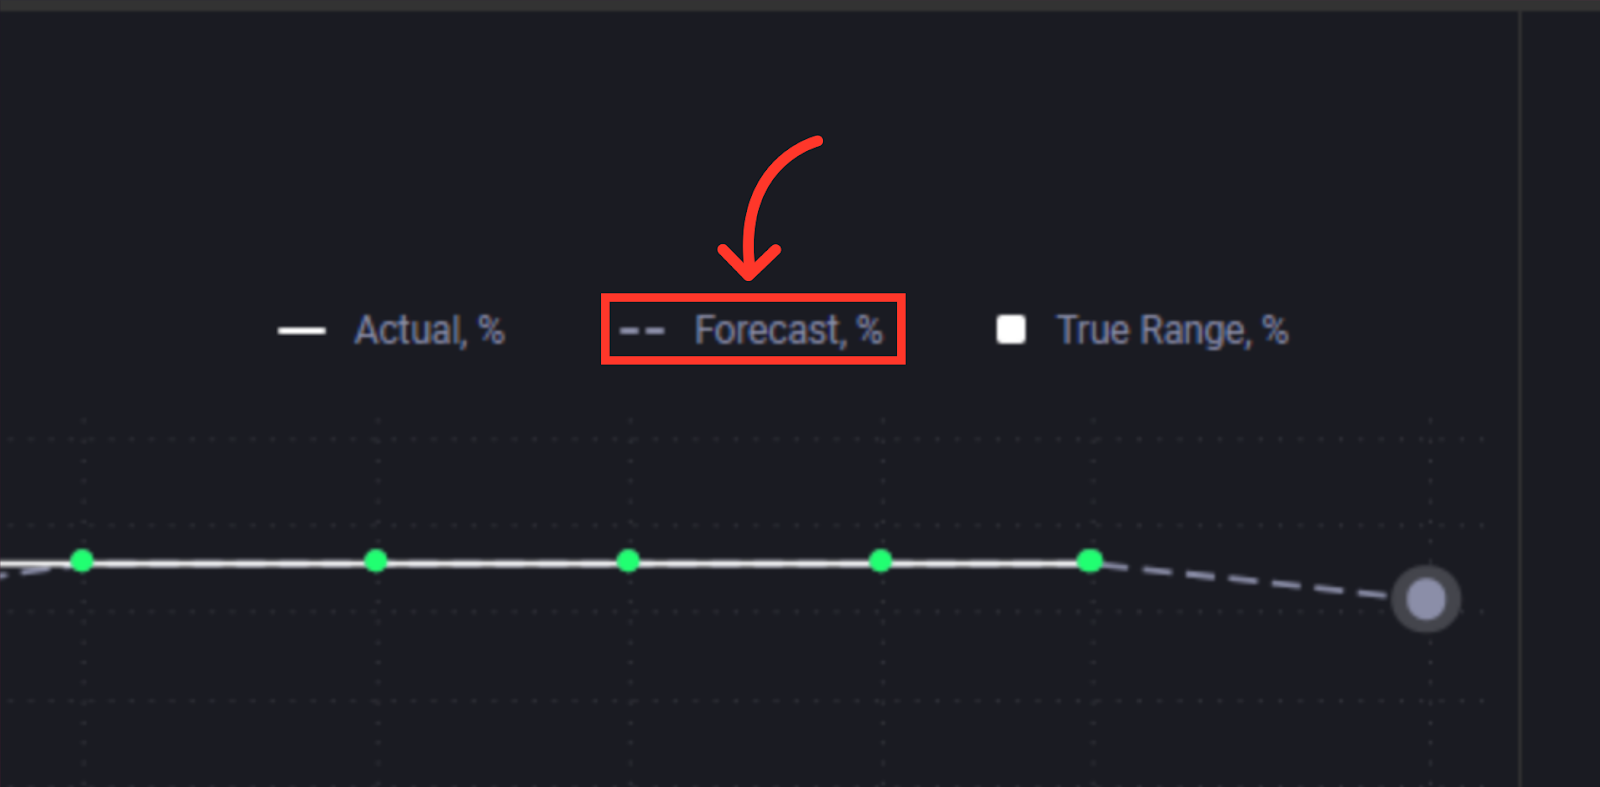
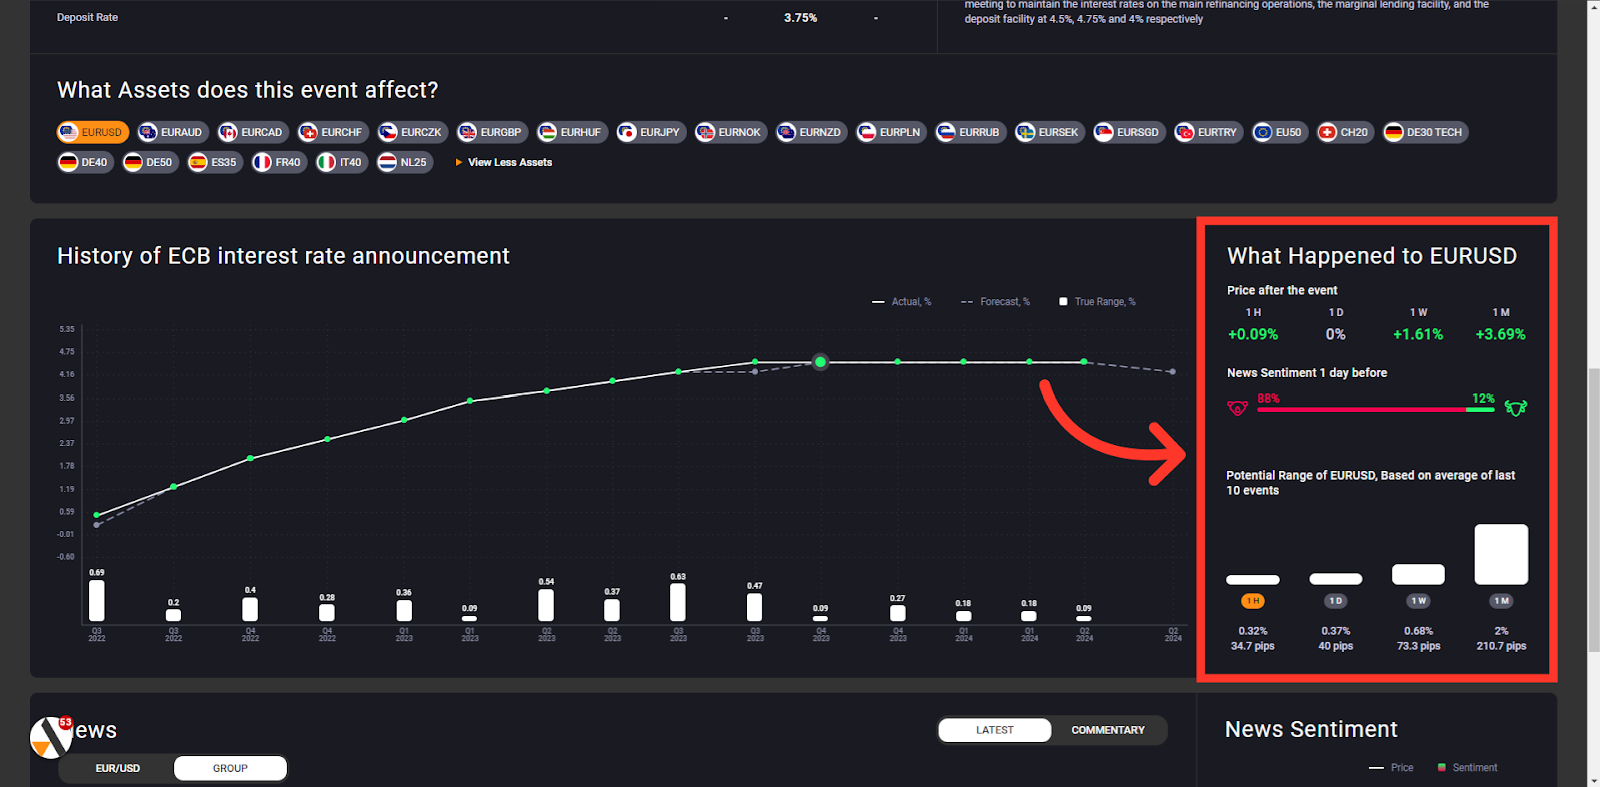
Event History
Visualize historic data readings to see how the actual data has performed compared to market expectations
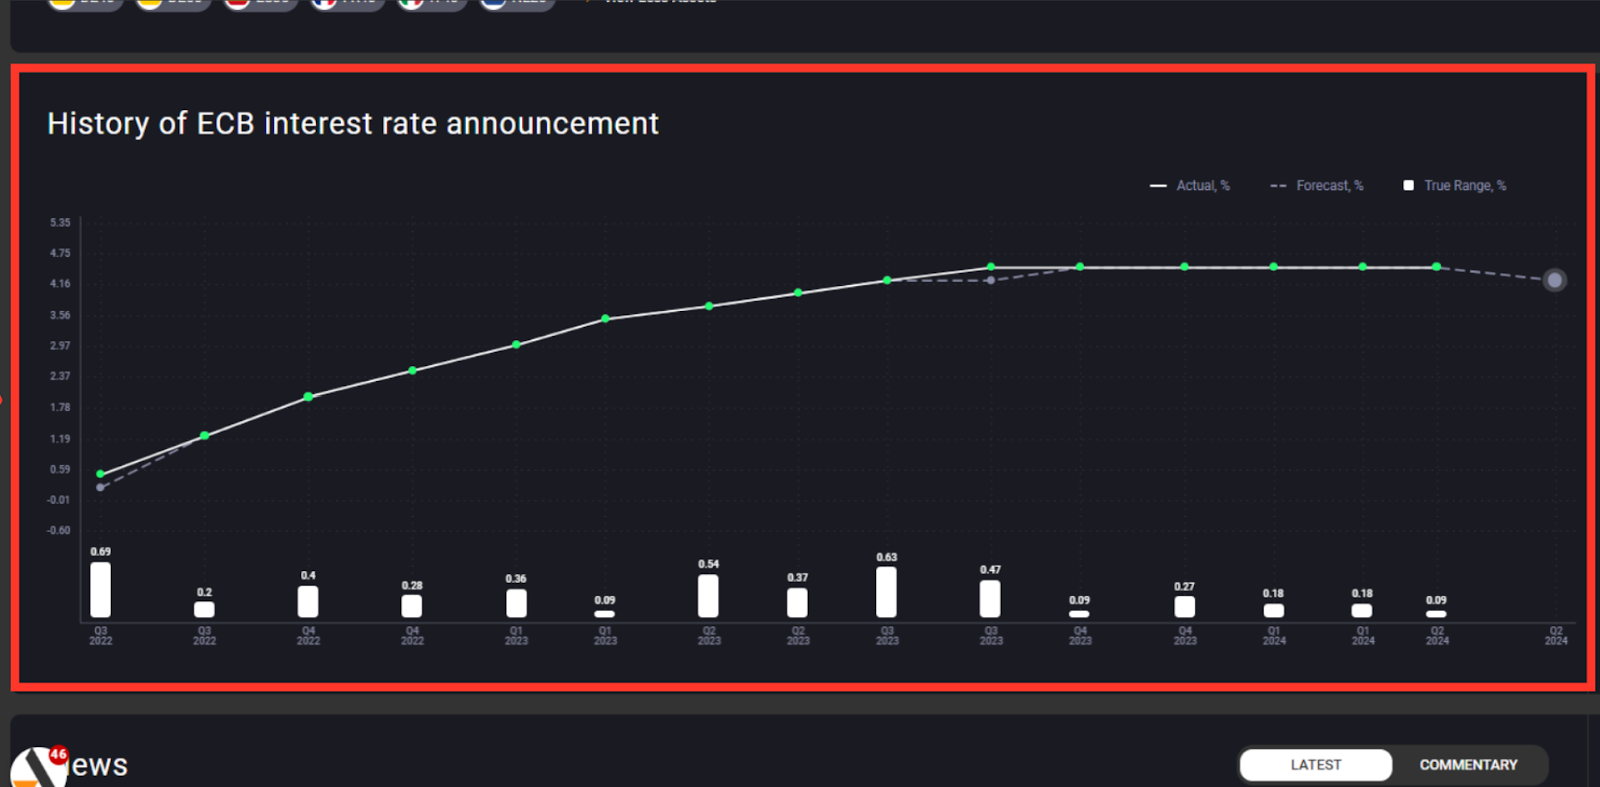
Actual %
The solid line demonstrates the actual data reading
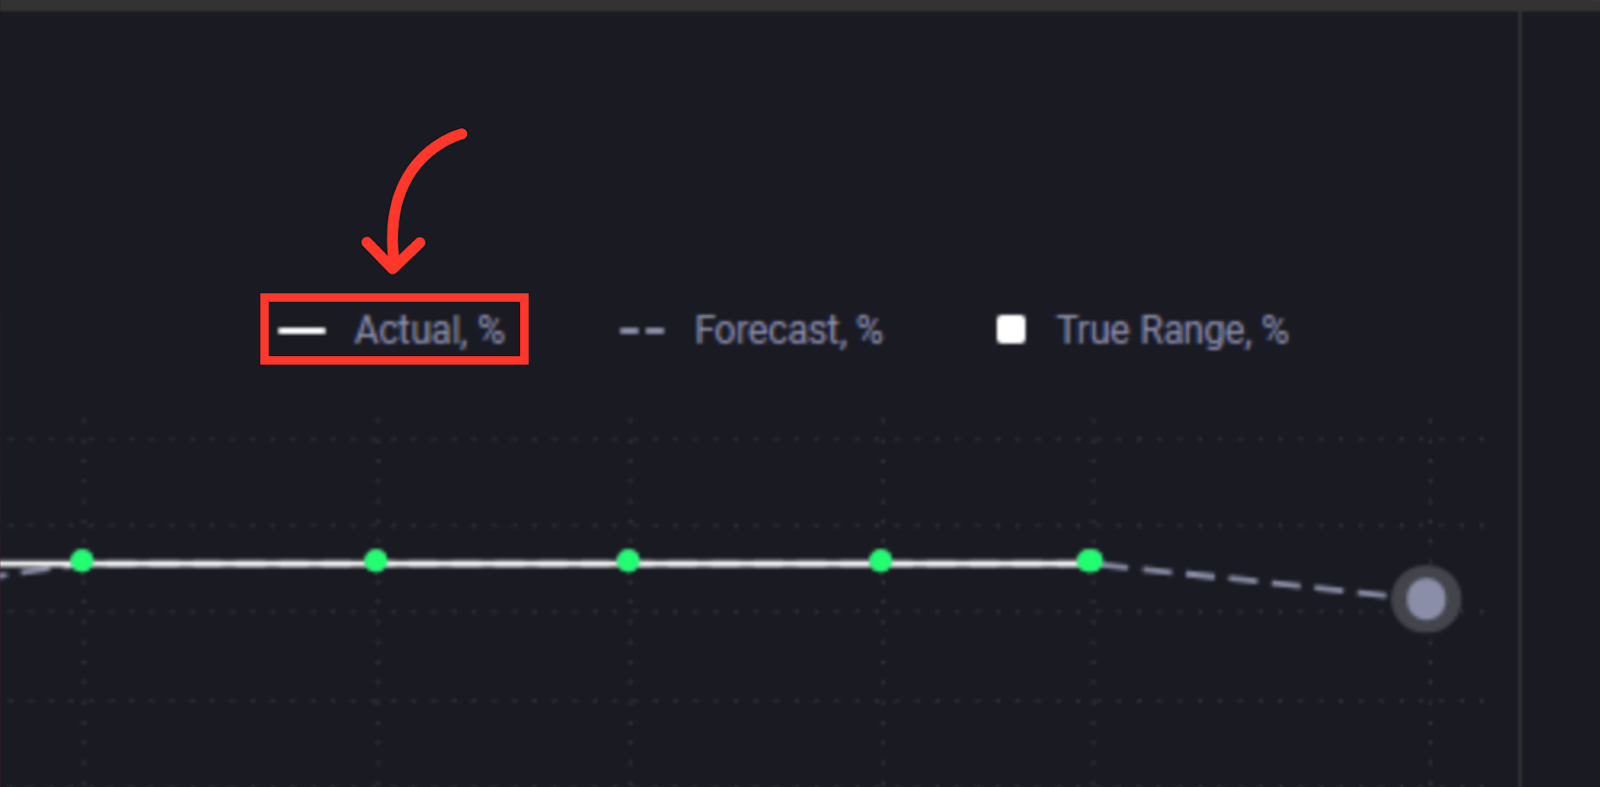
Forecast %
The dashed line shows the forecasted value of the data.
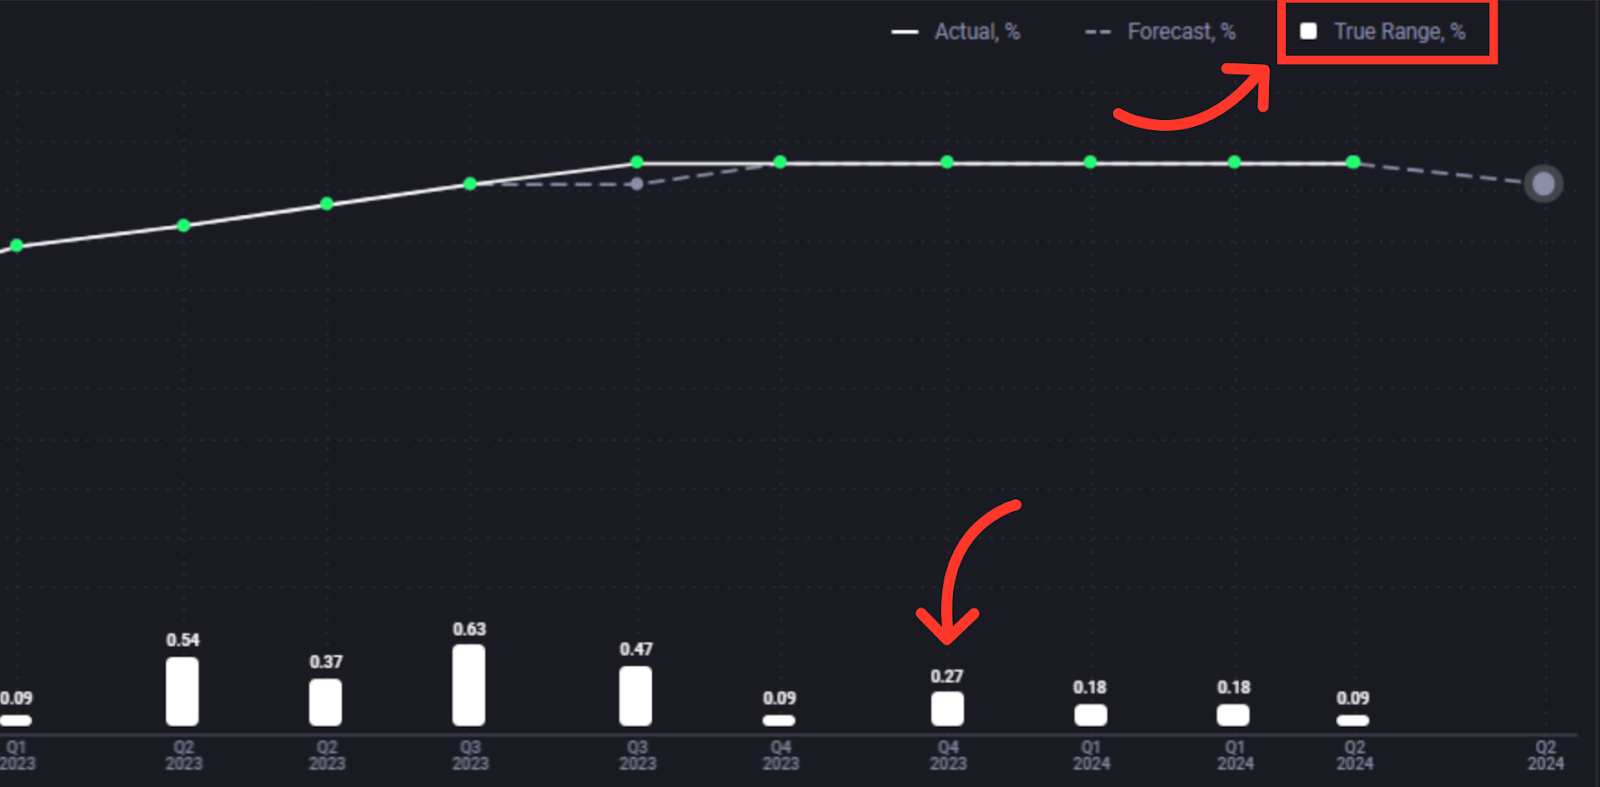
True Range %
The histogram at the bottom indicates the true range, showing how much the selected market moved in price on the day of the data release
Previous Events
Green dots indicate data above expectations, while red dots indicate data below expectations.
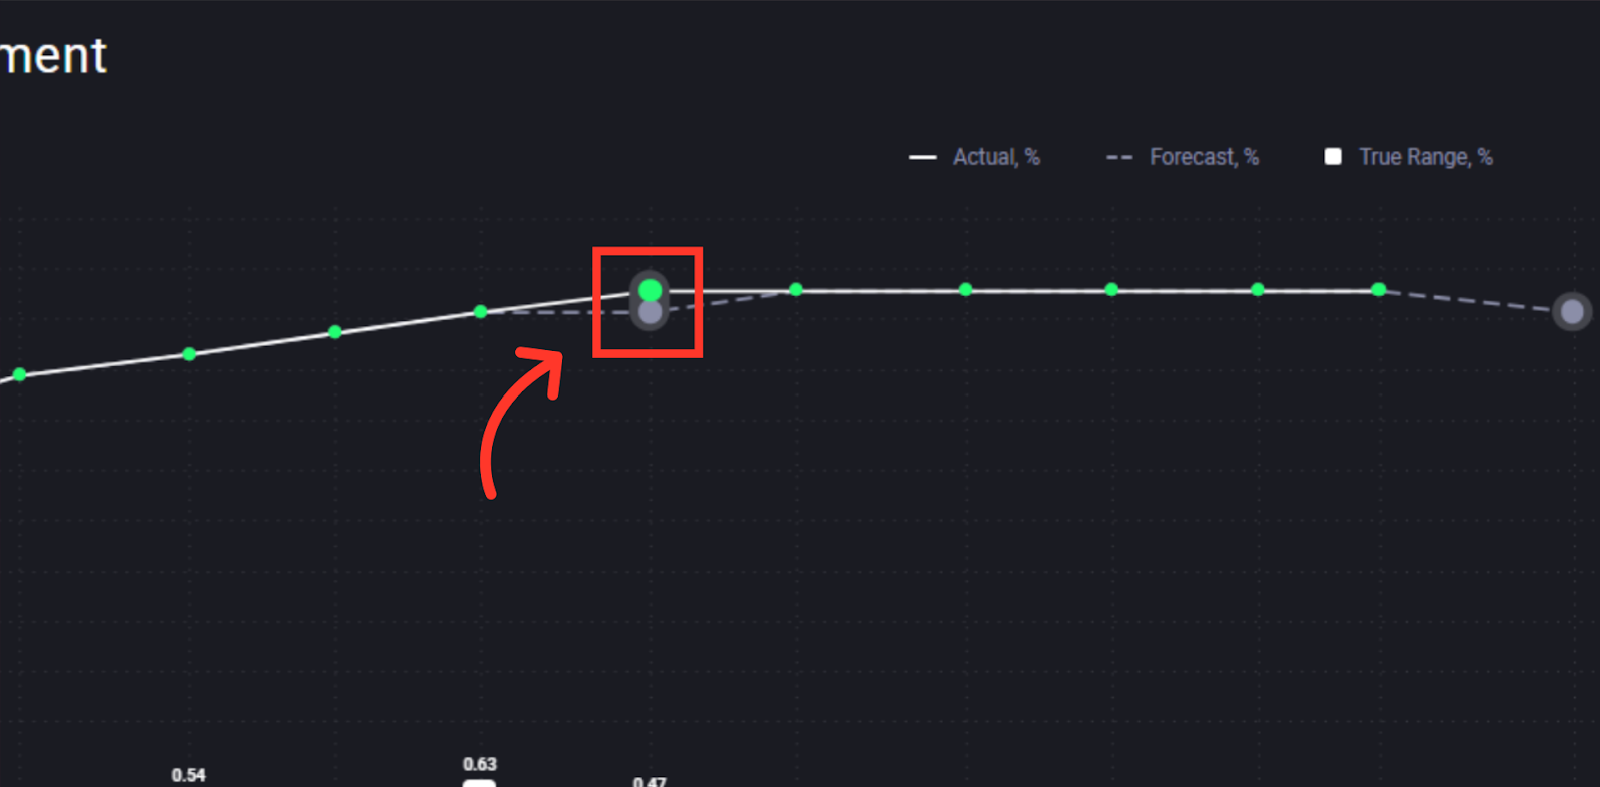
What Happened?
Traders can select previous events to observe how prices reacted at different time intervals following the data release.
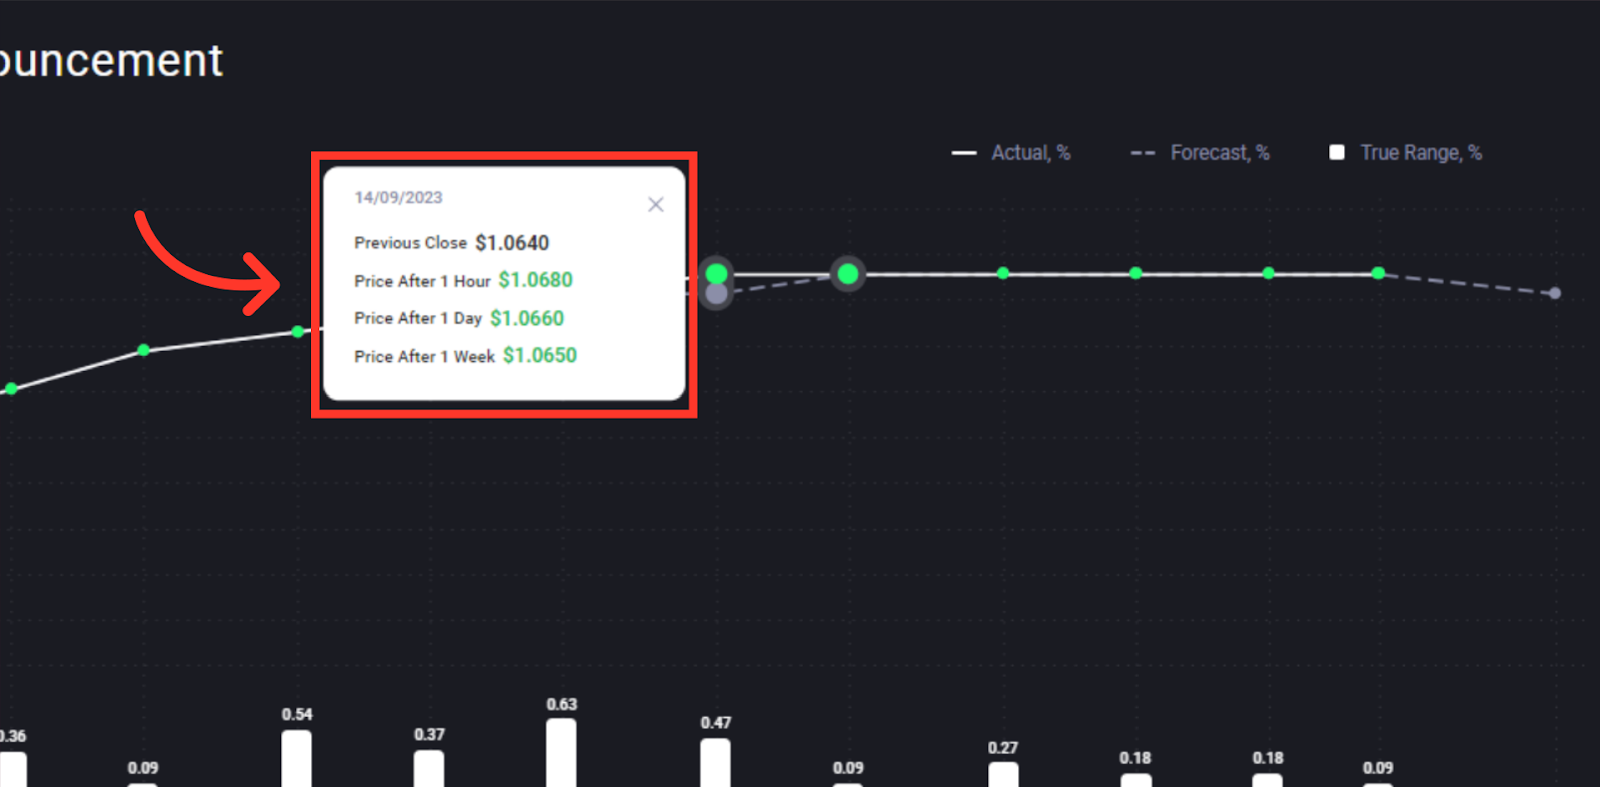
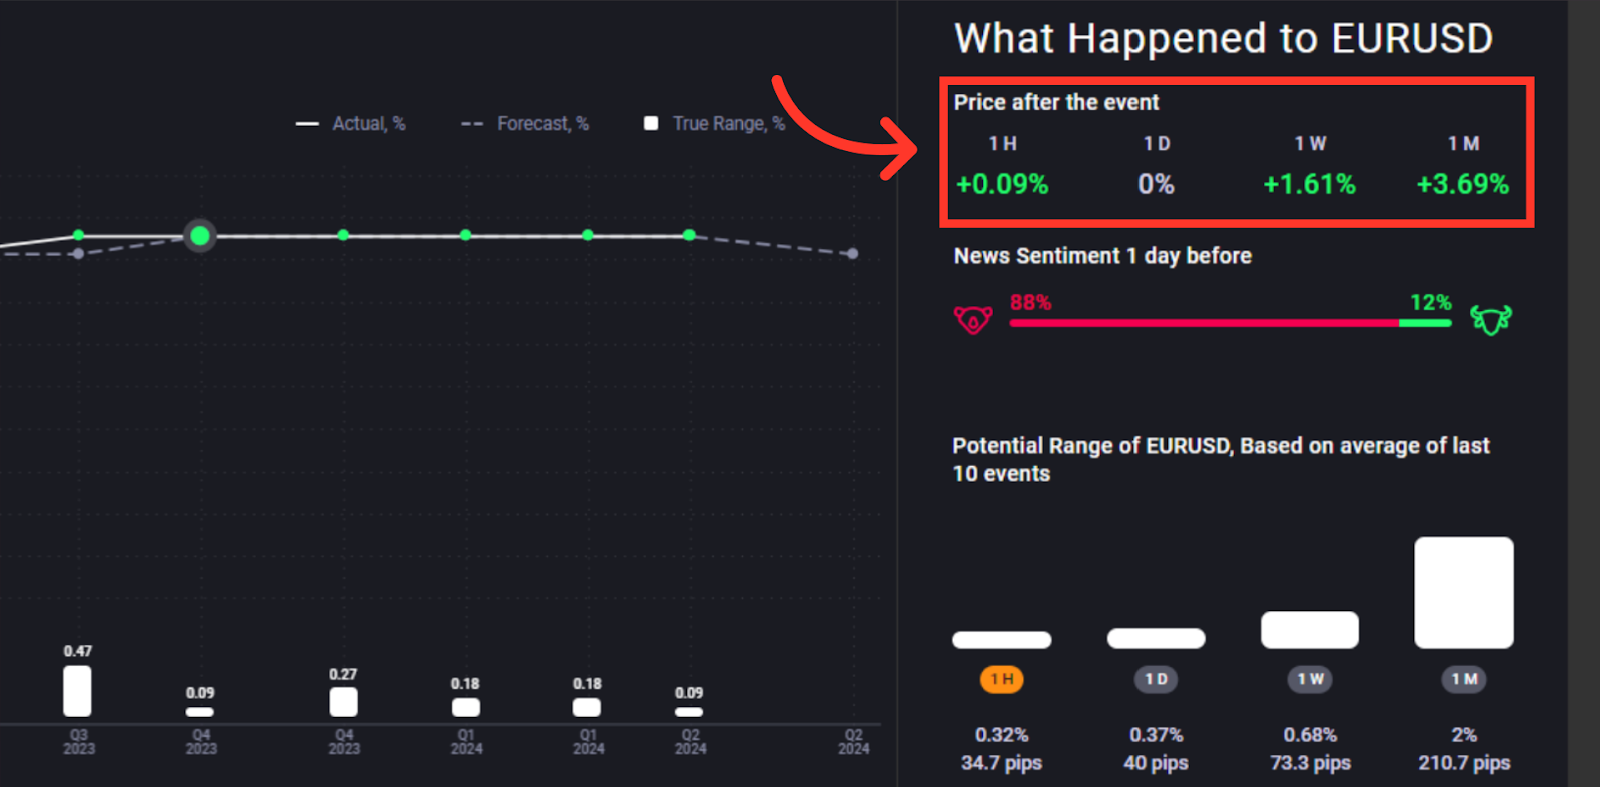
What Happened - Details
This can also be visualised to the right of the historic chart
Price after event
Easily observe how prices moved after any of the previous events displayed on the historic chart.
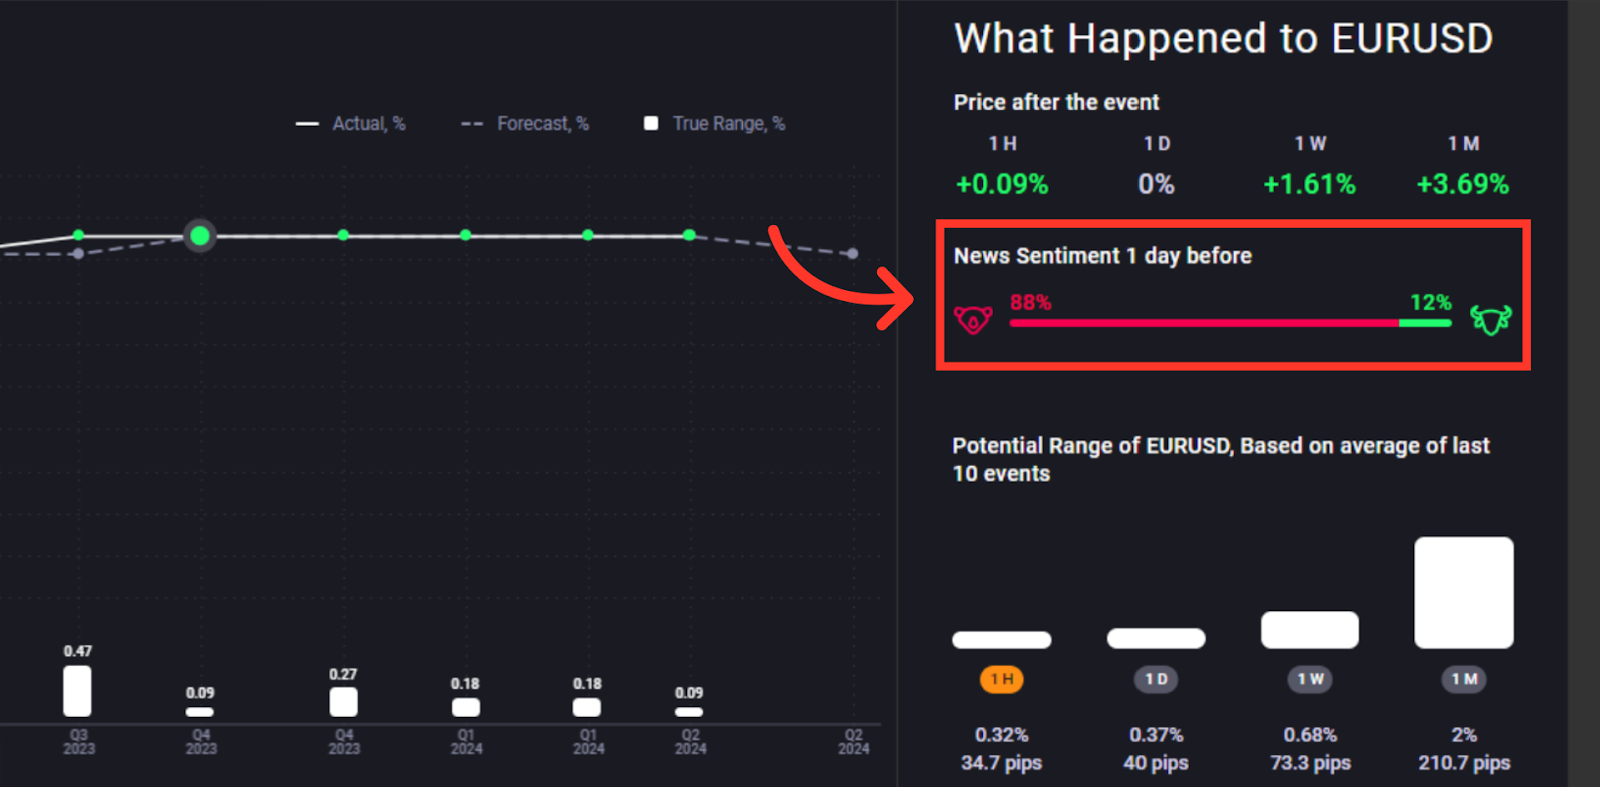
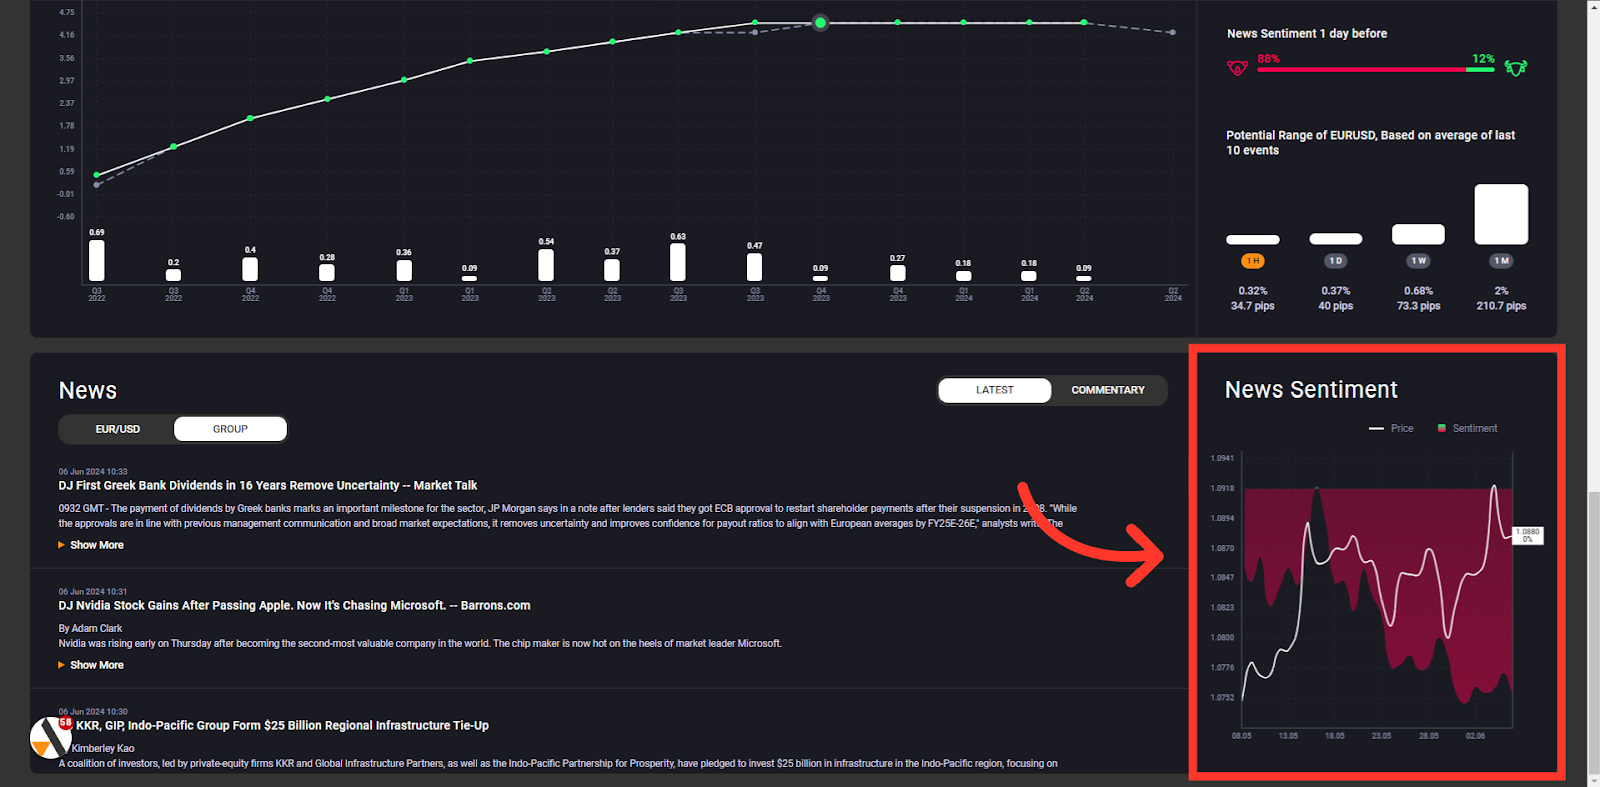
News Sentiment
Gain insight into how news sentiment was positioned one day before the event.
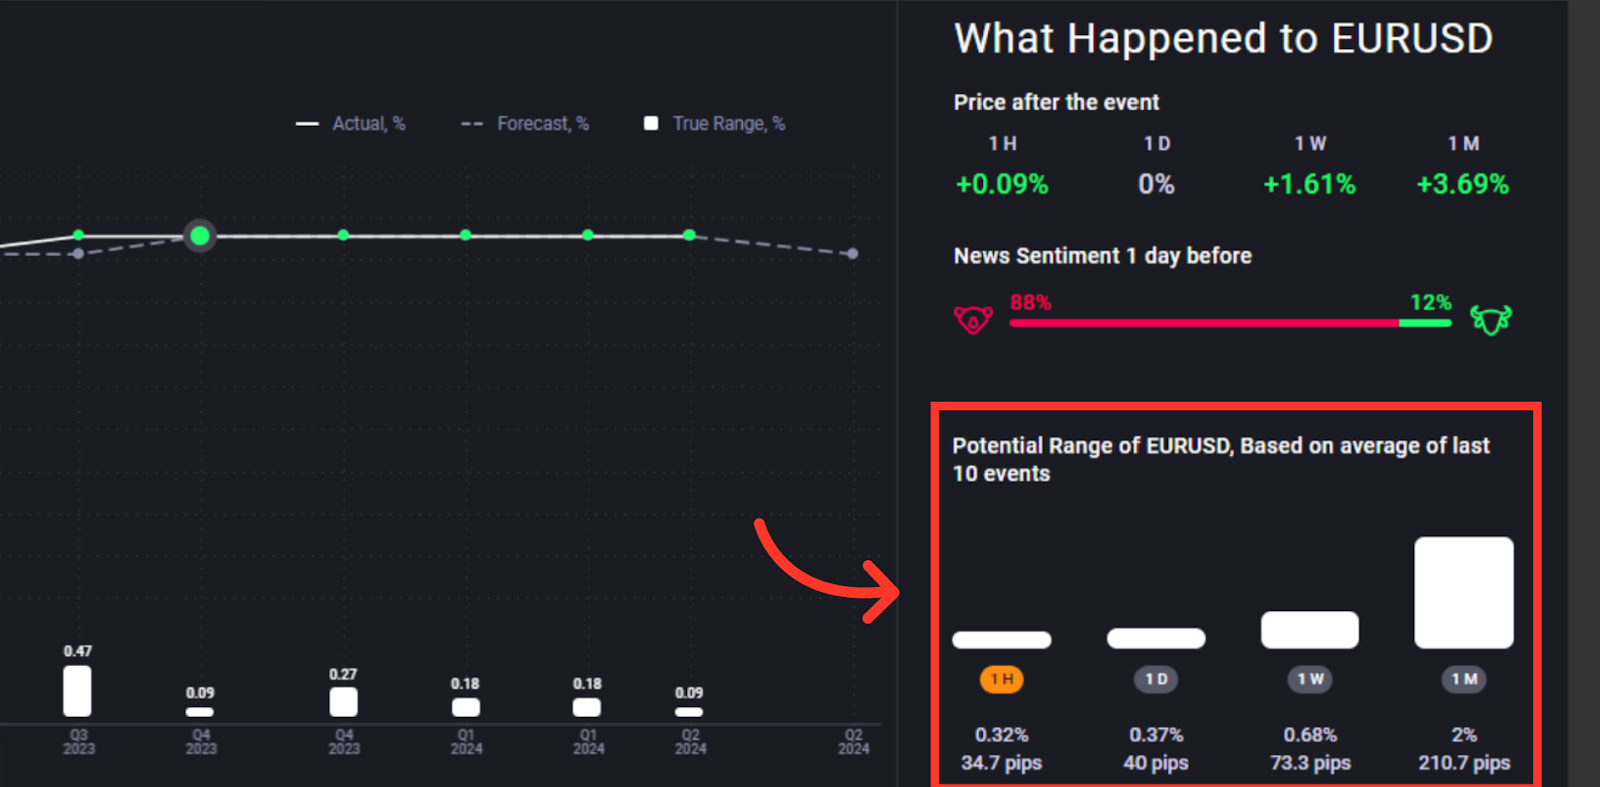
Potential Range
Using data from the previous 10 events, understand how prices have moved on average at different time intervals. This helps you plan your trades in advance, providing prior knowledge of the expected level of volatility.
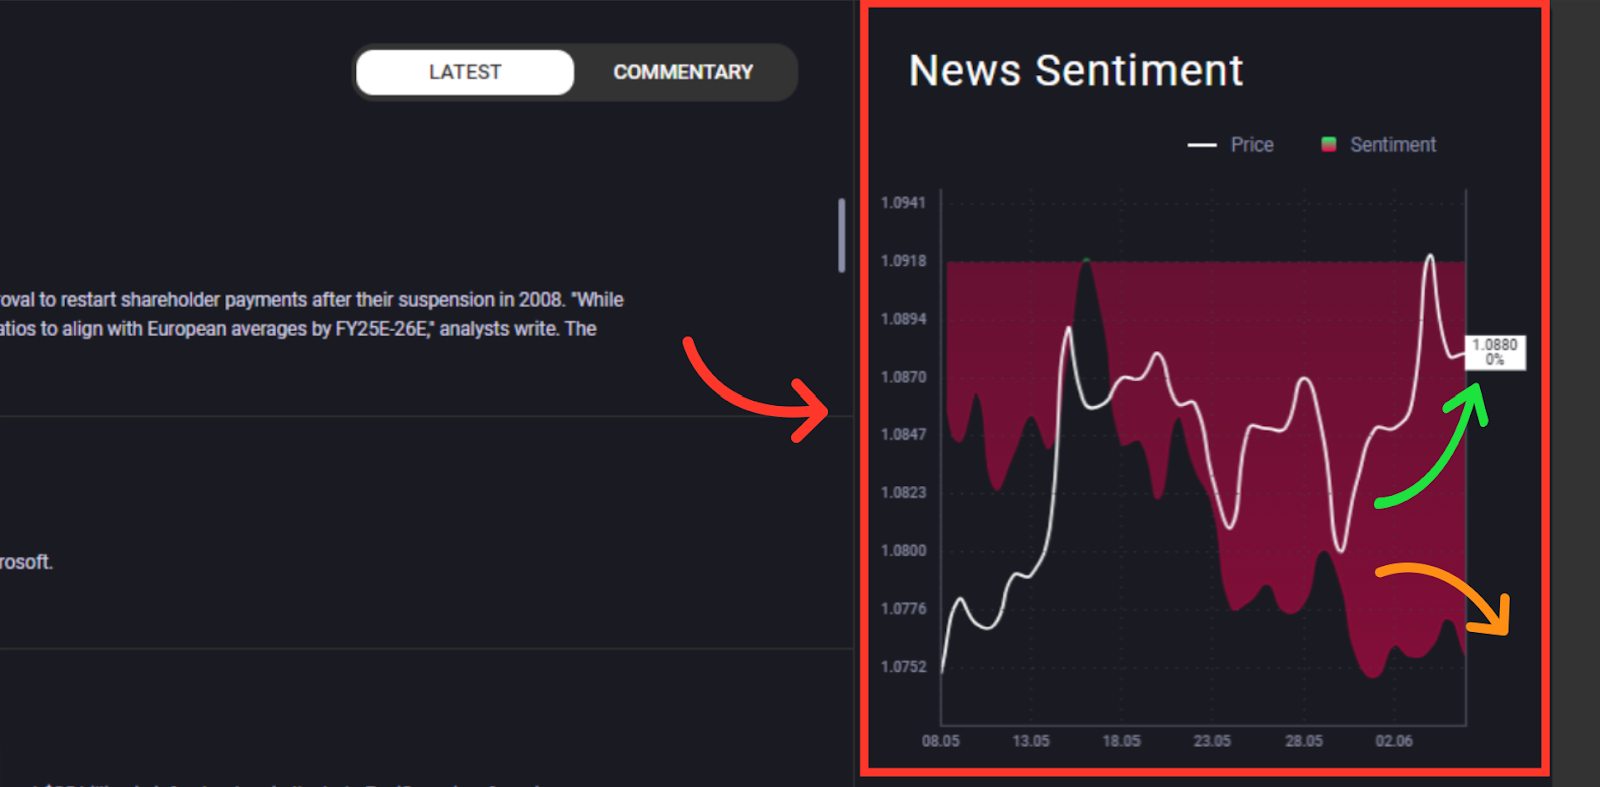
News Sentiment
Our proprietary news sentiment analysis utilizes AI to read millions of articles daily, summarizing sentiment towards thousands of financial assets. Track price and news sentiment to highlight correlations and divergences.
Interpreting News Sentiment
A red background indicates bearish sentiment in the underlying news, while a green background indicates bullish sentiment. When price and sentiment are correlated or moving in the same direction, it can indicate a healthy trend. However, when the two diverge, it may suggest that a price reversal is imminent.
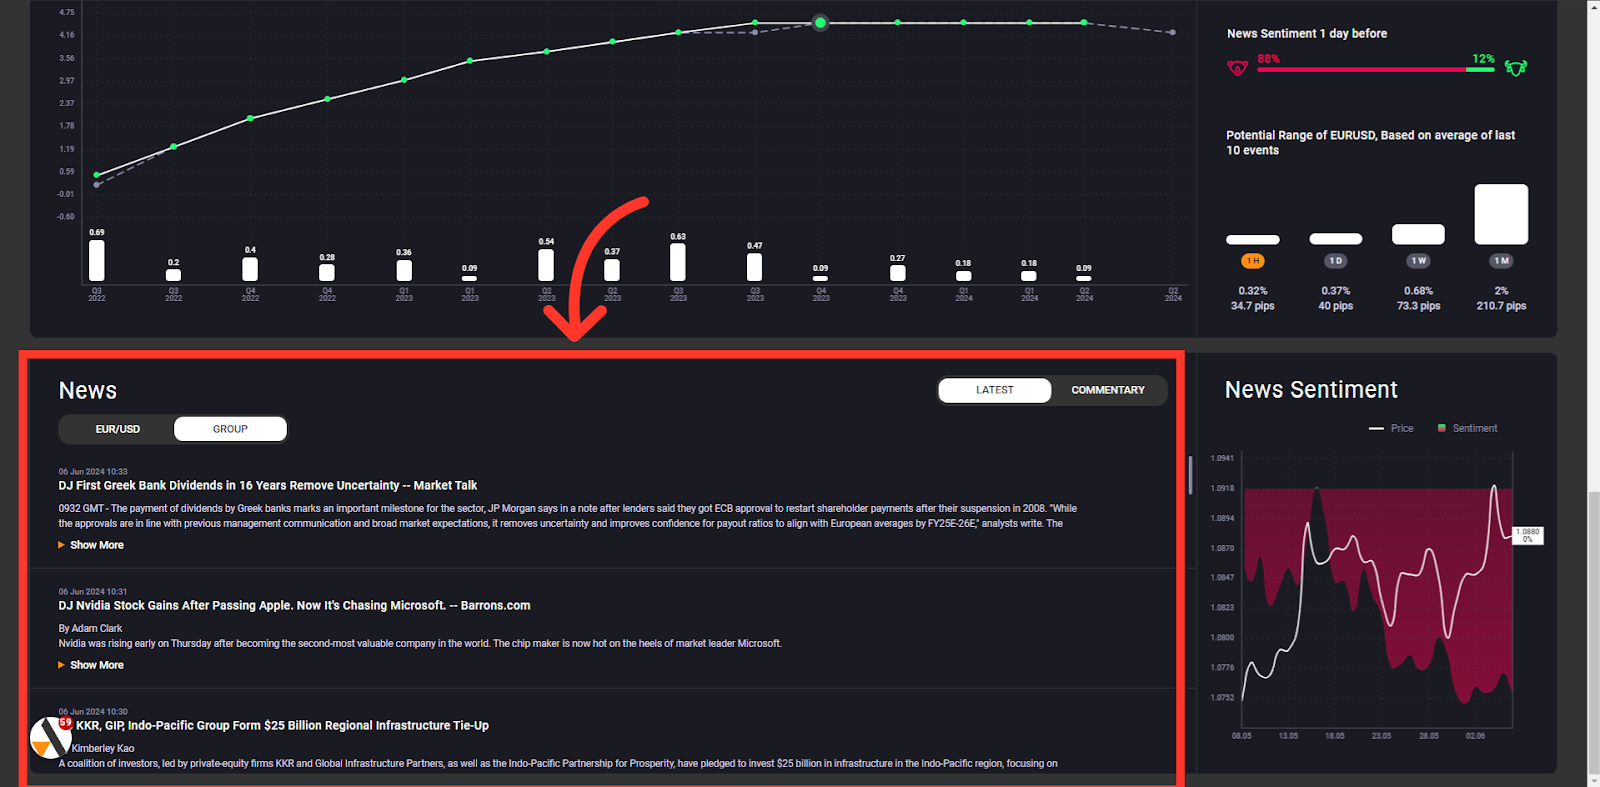
News Feed
Enhance your comprehension of what's driving financial markets with our curated selection of high-quality news articles from some of the most reputable and respected sources
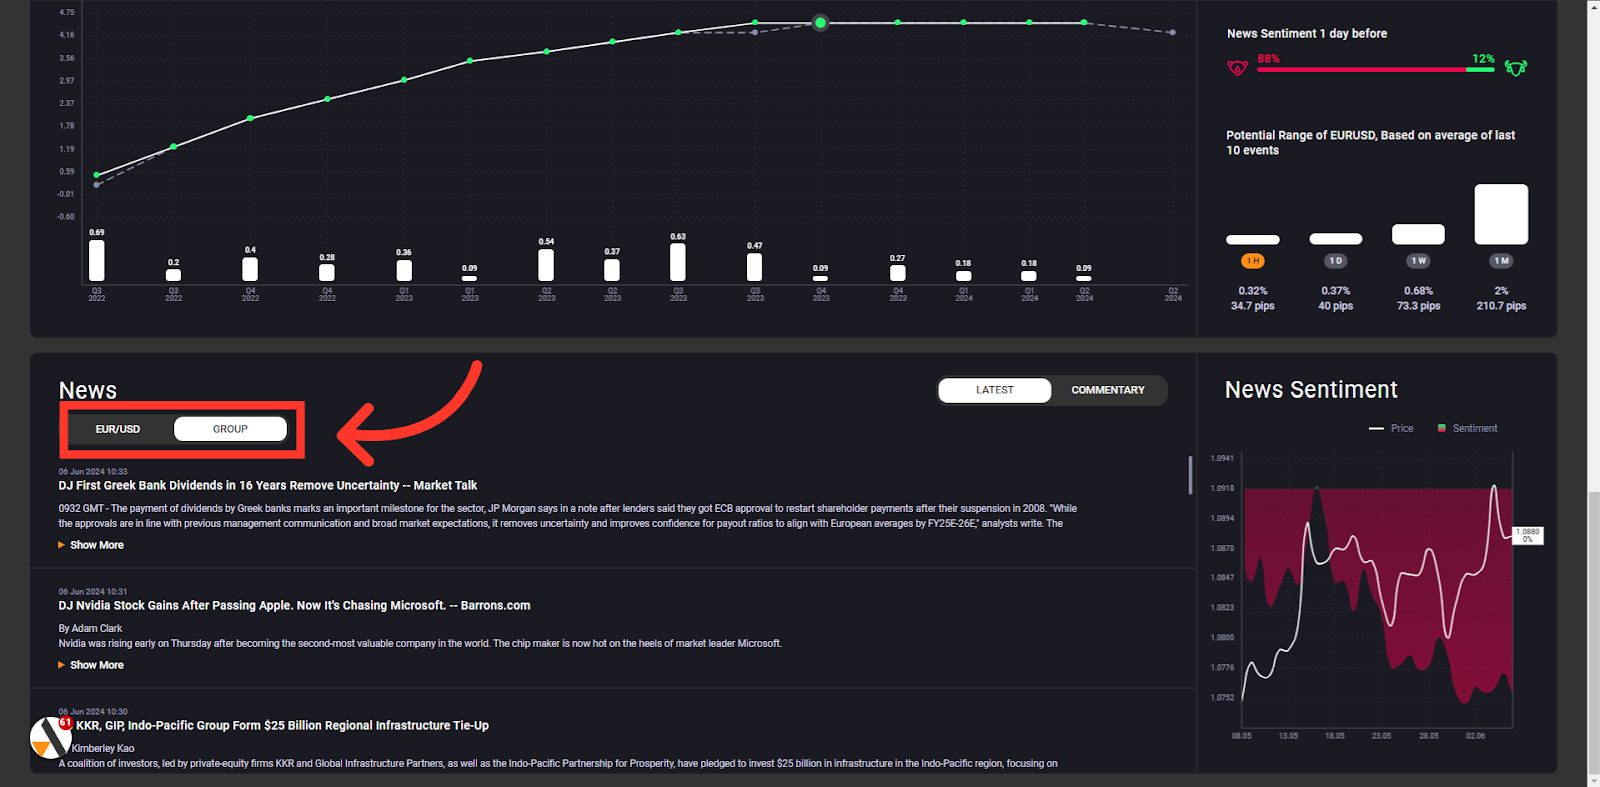
Asset/Group
Easily discover news articles relevant to the markets you're most interested in, or within wider asset classes, to gain a comprehensive understanding of market movers.
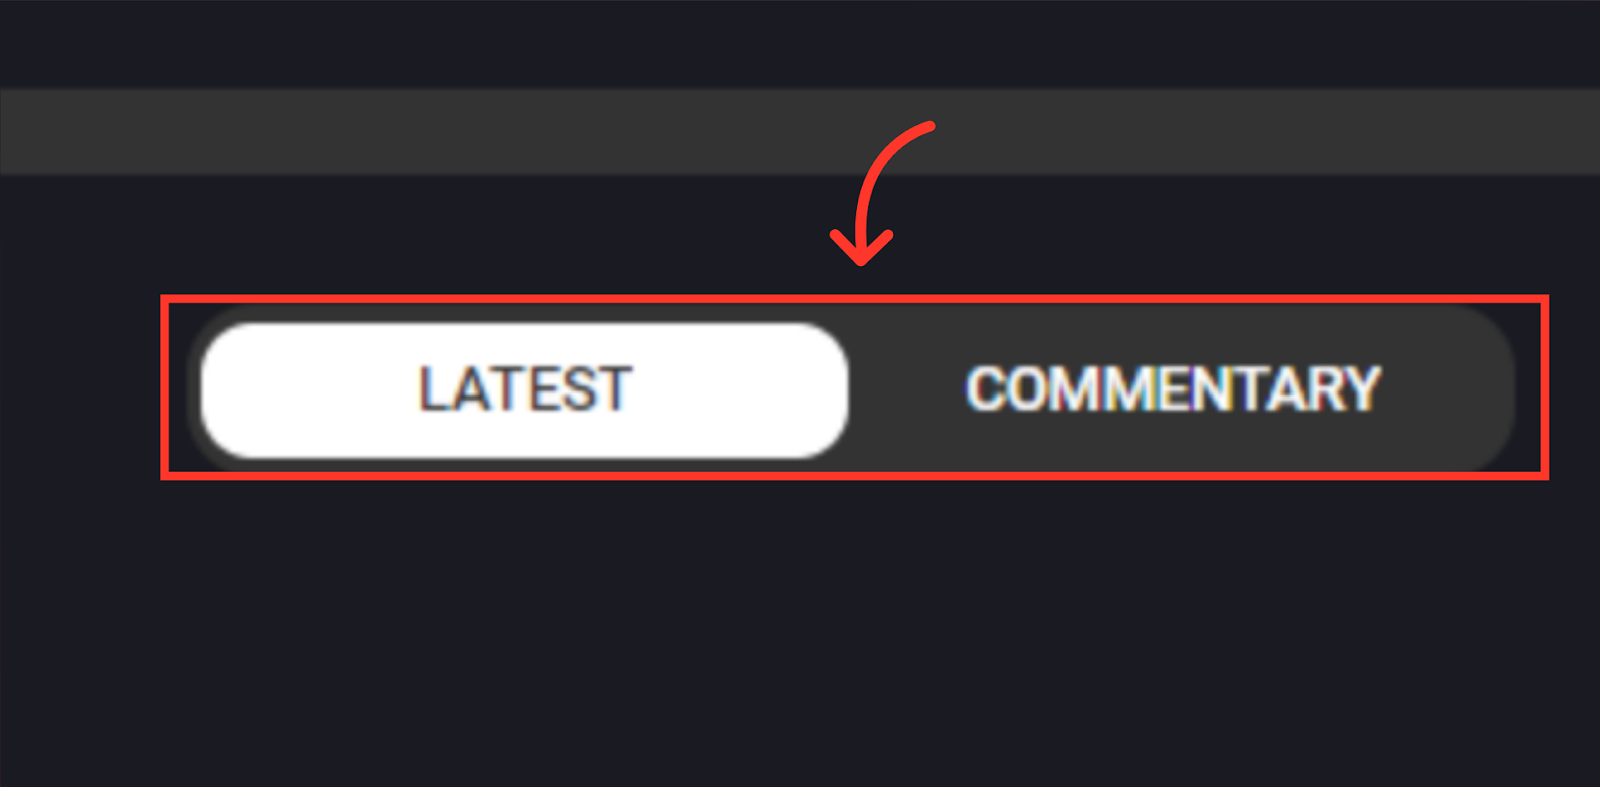
Latest/Commentary
Access the latest news and commentaries from some of the most respected journalists in the financial markets.
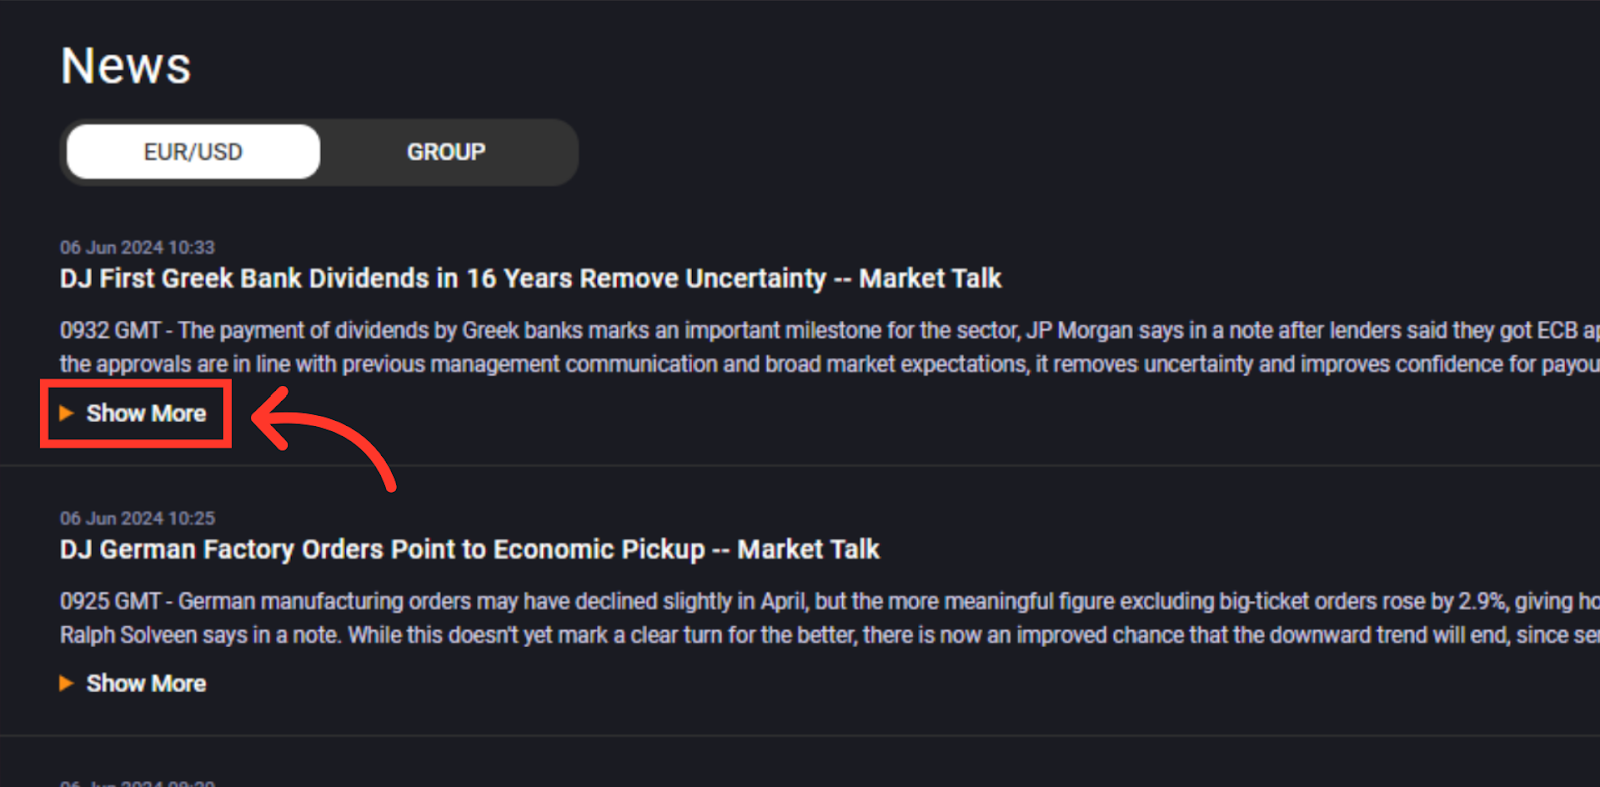
Show More
Access snippets from the news, or click 'Show More'
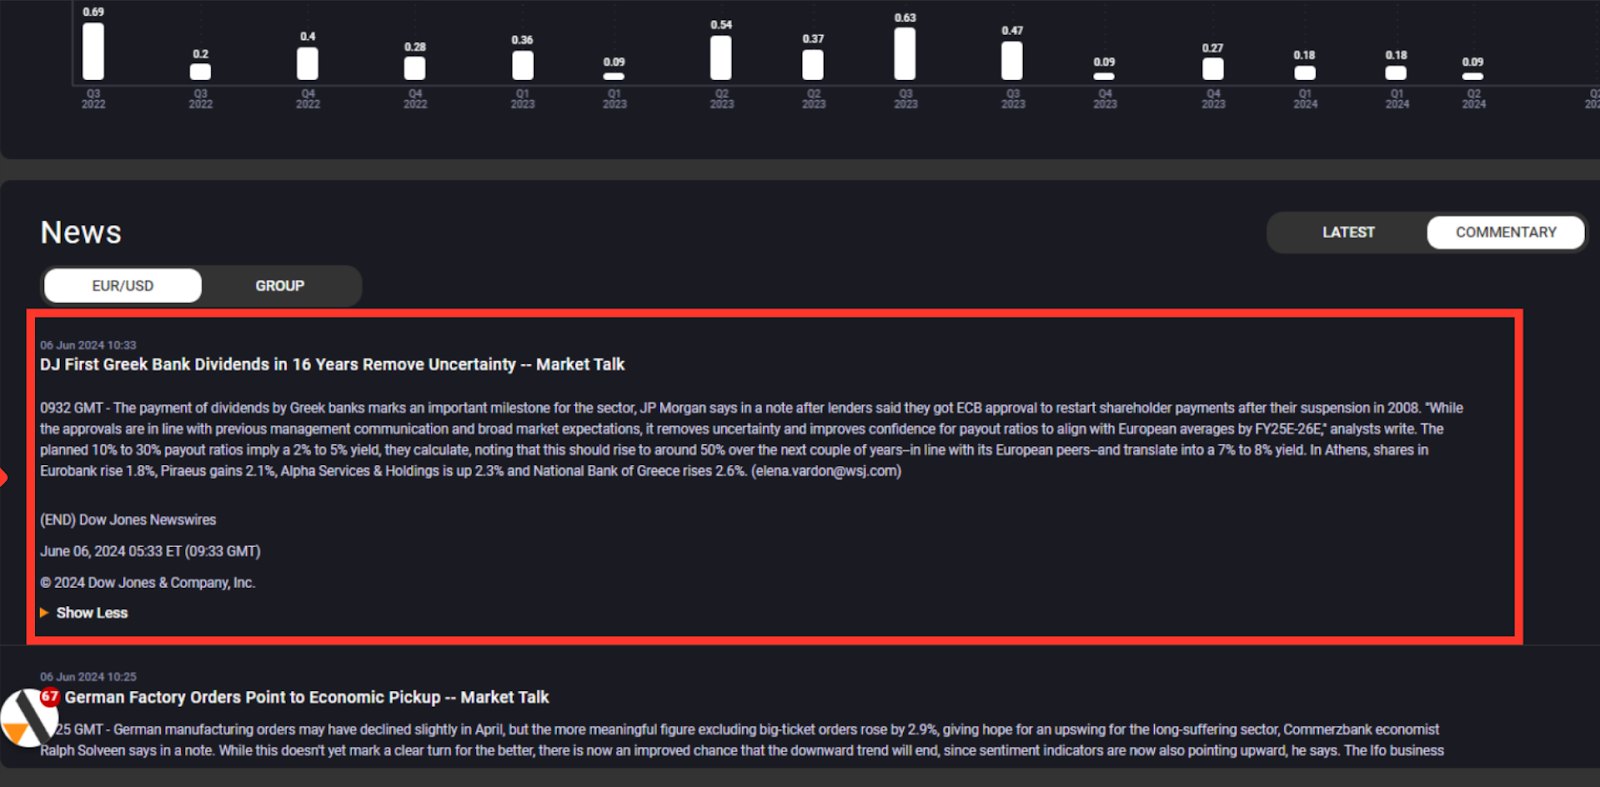
Full articles
this will display the full article directly within the calendar tool.
End
Stay ahead of market volatility with the Acuity Economic Calendar.

Acuity offers investors access to the sharpest investment data trends, tools, and analytics.