About AnalysisIQ
We combine experienced, human-led analysts with powerful, AI technology to conduct a deep analysis of the markets whilst drawing on our professional trading expertise to deliver robust risk/reward trade ideas that support novice and advanced traders alike.
Market Analysis
Acuity wholly owns PIA-First Limited which is FCA regulated. Our compliant-friendly approach uses advanced analysis techniques to understand the latest activity across all major markets and asset classes. Our team of experienced market professionals use both traditional and alternative data sets to gain a comprehensive view of the markets, from the short to the long term, to suit all trading styles.
Idea Generation
We turn our rich analysis content and data into instant, actionable trading ideas and longer term strategies, helping traders of all levels to gain an edge. Clear and concise, our trading signals are designed to make trading the markets simpler and more enjoyable for all.
Delivery
Our portfolio of products and delivery methods are designed to increase engagement and fit with individual trading styles, workflows and environments. Available in multiple languages across multiple time frames and accessible via multiple channels and automation solutions.
Methodology
Intraday Ideas
Buy or Sell trade ideas are published daily prior to the European market open, with a specified trigger level, 2 target levels, a stop loss level and an analyst confidence level.
If stop or target levels are not reached then the traded price at 21:00hrs (UK time), or in the case of Asian/Pacific ideas 16:00 hrs (UK time) the following day, will be used as a closing level for performance analysis. Prices may differ compared to your own online broker or brokerage account.
All our trading is based on Technical Analysis principles though many of the techniques we use were developed in house and form part of a bespoke online indicator.
Short-Term Trading Ideas and MT4 Financial Signals
For the short-term trader, Signal Centre publish trade ideas that have a longer projected time scale.
These reports are sent directly by email, or through MT4, with a specified trigger level, 2 target levels, a stop loss level and an analyst confidence level. Although a target and stop loss level are published in the idea, these can be adjusted as directed in live updates.
The performance report is based on the opening level and either the stop, 1st target or closing price.
Although a target and stop loss level are published in the idea, these can be adjusted as directed in live updates.
How we measure performance
We measure our trading performance using ‘R’ as we feel this is an honest and fair way of displaying our returns. You can get a clear picture of how we are performing and compare us to other analysis sites.
Our performance figures refer to past trading performance of our signals. Past performance is not a reliable indicator of future performance. Financial education is a better indicator of individual trader performance.
How do we calculate 'R'?
We use ‘R’ to display our trading performance because we do not want to advise our clients on how much they should be risking per trade without any knowledge of their circumstances.
To also use it for your own trading performance is a personal choice and depends on your financial circumstances and tolerance for risk.
A couple of methods you could use to calculate ‘R’ are as follows.
Decide upon a fixed amount of capital to put at risk on each trade. This maybe £10 or £10,000, ultimately you need to be able to accept losing that amount and be comfortable.
Alternatively, you could use a fixed percentage (%) of your investment capital per trade.
E.g. You have an account of £10,000 and decide to risk 0.50% of that amount on a per trade basis. So 1R in this instance would be £50.
Your ‘R’ figure will change based on the value of the account in this scenario. So, if you lose 1R, your account will be £9,950. When you place the next trade and risk 0.5% your 1R figure will be £49.75.
Example of R in practise:
Buy FTSE at 7120, Stop at 7100, Target at 7180.
20 points is the difference between our stop and entry level.
If your strategy is to risk £100 per trade, then you divide the monetary value by stop amount.
E.g. £100 / 20 = 5
Trade size is £5 per point.
If the trade is stopped out. You will lose 20 points.
£5 per point x 20 = -£100 (or -1R)
If the trade hits the target. You will make 80 points.
£5 per point x 80 = £400 (or 4R)
‘R’ in live environment
This is our 2017 EURUSD performance.
Trades: 98
Wins: 49
Losses: 42
Flat: 7
Average R: 0.163
The chart below displays the monthly ‘R’ return on EURUSD during 2017.

The chart below displays the ‘R’ return on EURUSD during 2017.
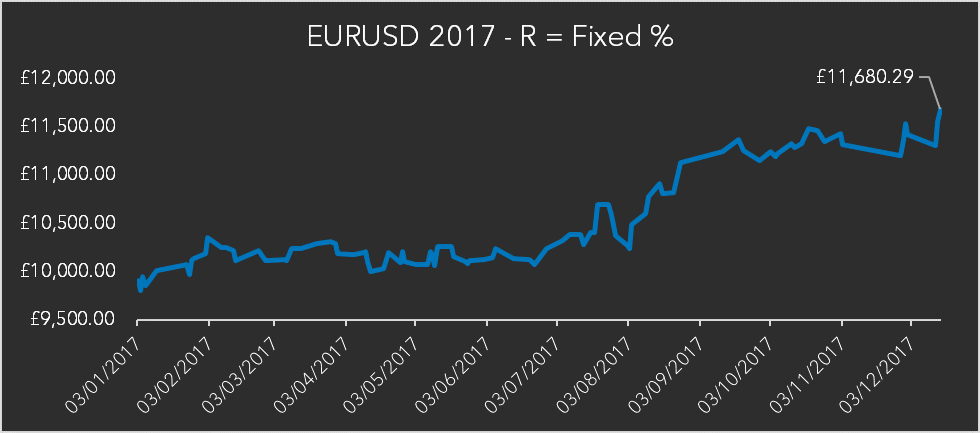
Returns over the period total £1,680.29 or 16.80%.
Example 2: Fixed £ Risk
R = Fixed £ risk
Figures based on £10,000 trading account risking £100 of the capital per trade.
1R = £100
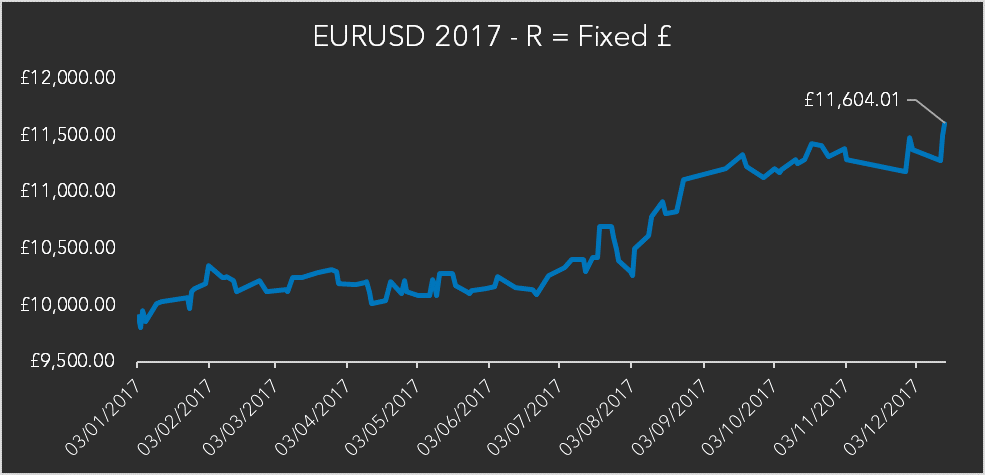
Returns over this period total £1,604.01 or 16.04%.
*Returns are greater in example 1 because of compounding.
Performance Report
Below is an image of various performance metrics generated as a result of the analysis/trading signals from Signal Centre from January 1st 2017 - 29th August 2023.
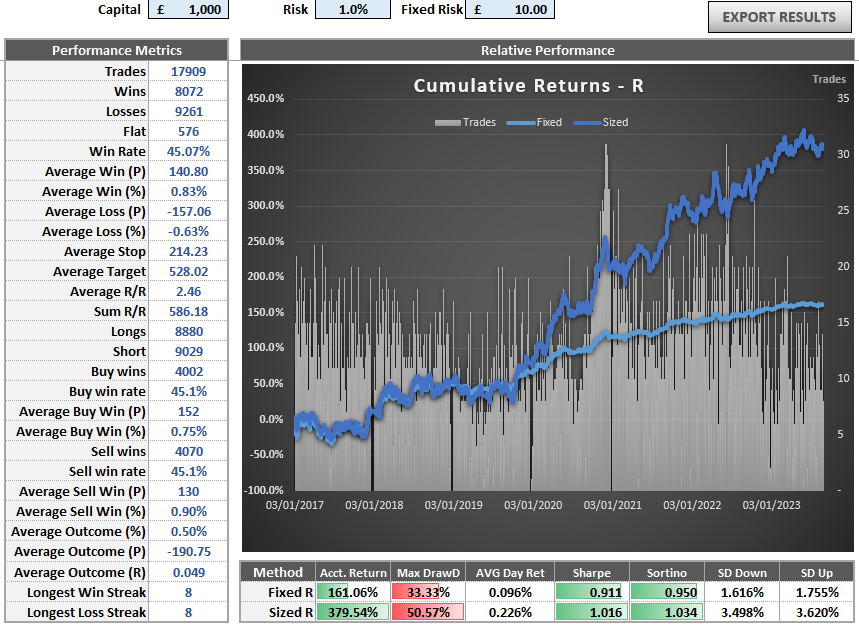
Results are based on risking 1% of trading capital per trade (Sized R) and risking a fixed amount of trading capital of £10 (Fixed R)
Both performance statistics are based on a hypothetical starting balance of £1,000.
- Trades: The amount of trade ideas published during the display period (in this case from January 1st 2017 - 29th August 2023)
- Wins: How many of the trades published have had a positive outcome
- Losses: How many of the trades published have had a negative outcome.
- Flat: How many of the trades published have neither produced a positive or negative outcome.
- Win Rate: What percentage of the trades published have had a positive outcome (Wins / Trades)
- Average Win (P): The points (pips) value of the average trade that had a positive outcome.
- Average Win (%): The percentage(%) gain of the average trade that had a positive outcome.
- Average Loss (P): The points (pips) value of the average trade that had a negative outcome.
- Average Loss (%): The percentage(%) gain of the average trade that had a negative outcome.
- Average Stop: The average points(pips) amount used to determine a stop loss (Difference between the entry level and the stop loss.
- Average Target: The average points(pips) amount used to determine a target (Difference between the entry level and Target 1.
- Average R/R: The average Risk/Reward of the trades published during the display period. (Average Target / Average Stop)
- Sum R/R: The combined total across the display period of the R/R (Risk/Reward) accumulated.
- Longs: The amount of trades that have been recommended as a 'Buy' in the display period.
- Shorts: The amount of trades that have been recommedend as a 'Sell' in the display period.
- Buy Wins: The amount of Long(Buy) trades that have had a positive outcome in the display period.
- Buy Win Rate: The percentage(%) of Long(Buy) trades that have had a positive outcome in the display period (Buy wins / Longs)
- Average Buy Win (P): The points (pips) value of the average Long(Buy) trade that had a positive outcome.
- Average Buy Win (%): The percentage(%) gain of the average Long(Buy) trade that had a positive outcome.
- Sell Wins: The amount of Short(Sell) trades that have had a positive outcome in the display period.
- Sell Win Rate: The percentage(%) of Short(Sell) trades that have had a positive outcome in the display period (Sell wins / Shorts)
- Average Sell Win (P): The points (pips) value of the average Short(Sell) trade that had a positive outcome.
- Average Sell Win (%): The percentage(%) gain of the average Short(Sell) trade that had a positive outcome.
- Average Outcome (%): The average percentage(%) outcome of all trades (winning and losing trades) during the display period.
- Average Outcome (P): The average points(pip) outcome of all trades (winning and losing trades) during the display period.
- Longest Win Streak: How many consecutive trades have had a positive outcome during the display period.
- Longest Loss Streak: How many consecutive trades have had a negative outcome during the display period.
RISK WARNING
The simulated performance statistics provided are based on the assumption of risking 1% of trading capital per trade. It is crucial to understand that past performance, whether actual or simulated, is not indicative of future results. Trading involves substantial risk and is not suitable for every investor. The figures presented are hypothetical and do not account for real market conditions, such as liquidity, slippage, or transaction costs. You should be aware of the risks involved and be prepared to potentially lose your entire investment. Always seek independent financial advice before making trading decisions.
If you haven't found what you're looking for yet, don't worry! Our team is here to assist you.