New Traders
Typical characteristics of a New Trader
Little experience, want inspiration, lacking ideas, excitable, trust expert opinion, want high conviction, ready to act quickly.
Below is an image of the expected journey a new trader will take using our Signals.
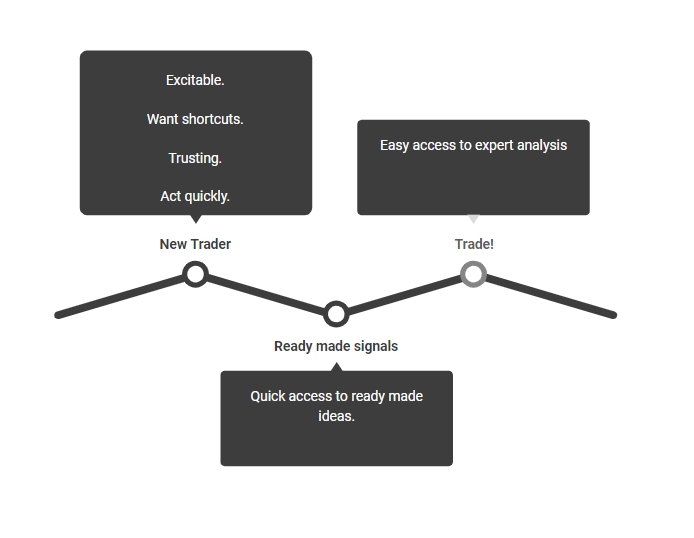
The first area a new trader will see is the Signals Home Page section.
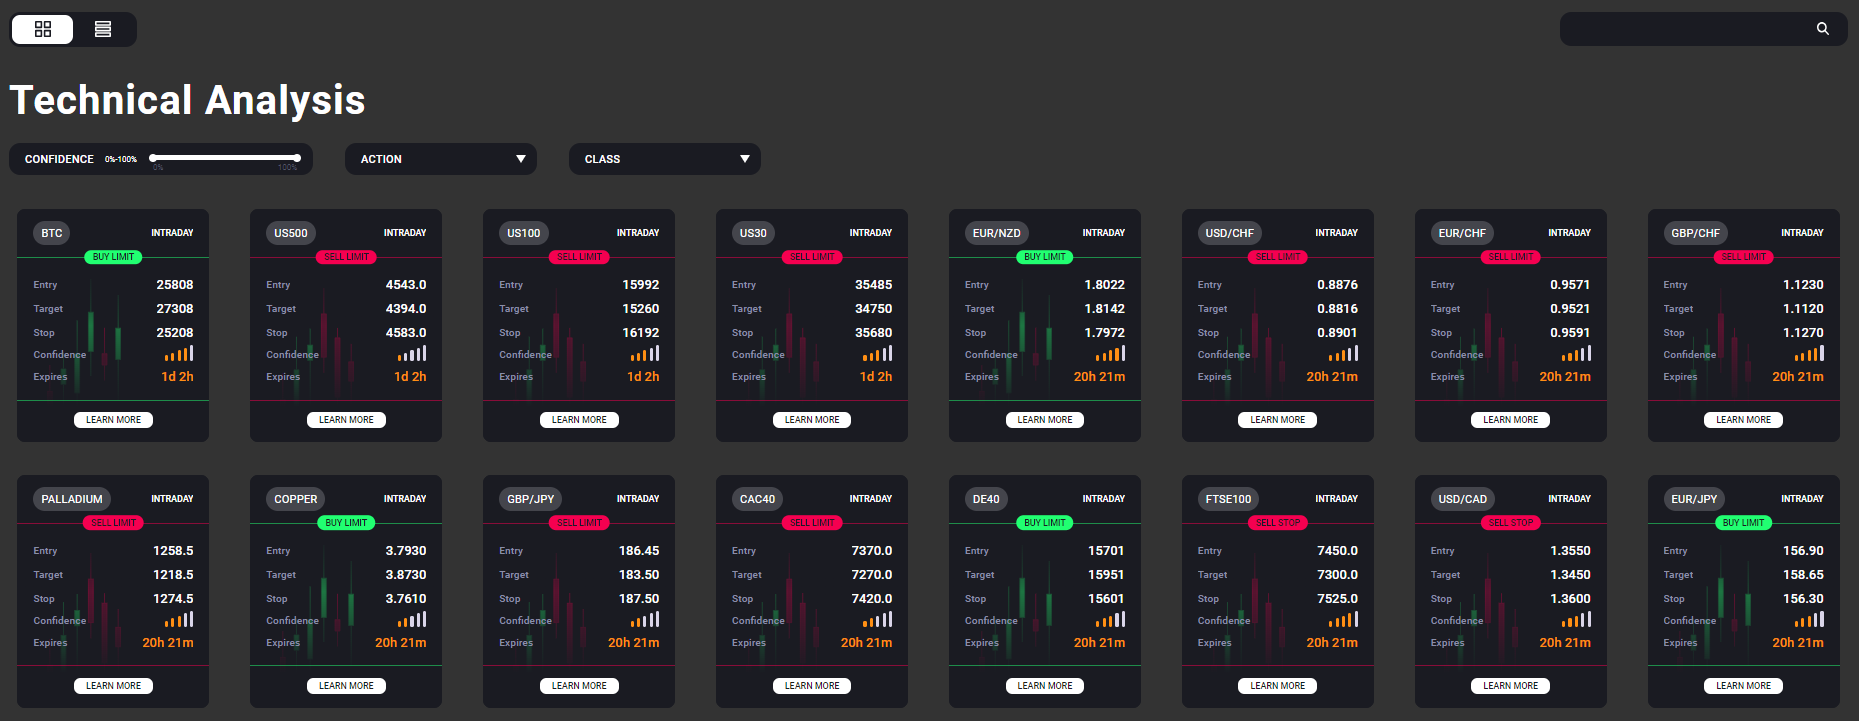
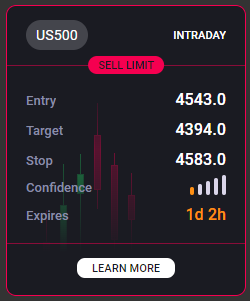
This pages highlight ALL of the latest signals published for the day. Four types of orders are used to execute the trades. All signals are created using 'Pending' orders, which provide traders with a clear and direct level at which to enter the individual markets.
Order Types
- Buy Limit - An order to BUY the asset at a lower price than it is currently trading at.
- Sell Limit - An order to SELL the asset at a higher price than it is currently trading at.
- Buy Stop - An order to BUY the asset at a higher price than it is currently trading at.
- Sell Stop - An order to SELL the asset at a lower price than it is currently trading at.
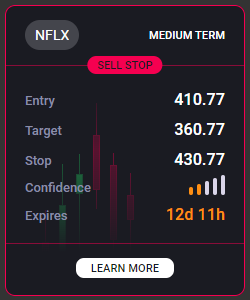
Most trade ideas are published as 'Intraday', the expectation is that these ideas will reach the desired entry point within one day. These ideas are only valid for a 23 hour period, at which point new trade ideas are published.
Trade ideas on Stocks/Equities are published as 'Medium term', the expectation is that these ideas will reach the desired entry point at some point within a 1 week period, and the idea can remain valid for up to 2 months.
Filtering Options
Technical Analysis Filtering Options
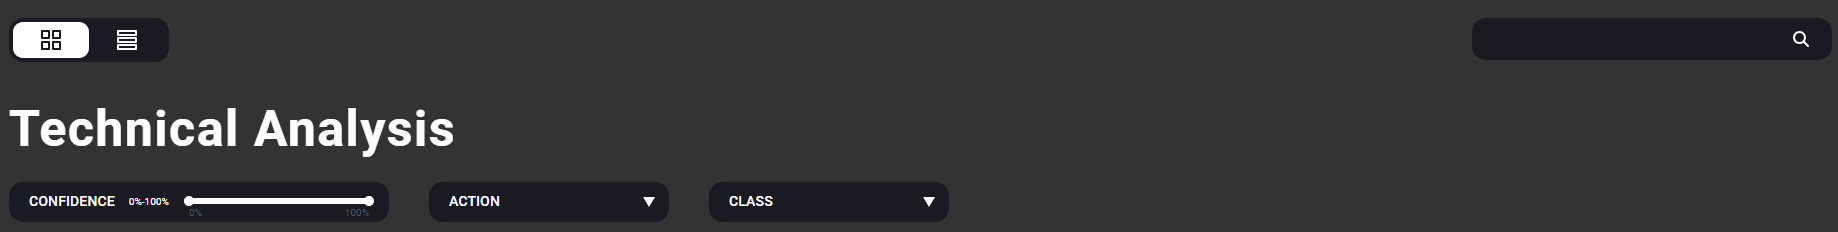
There are four methods that can be used to filter signals in the Technical Analysis Dashboard.
- Confidence: Traders can use the scroll feature to limit ideas by our proprietary confidence scoring methodology. Confidence scores range between 20 - 80%.
- 80% = Highest confidence, 20% = Lowest confidence
- Action: This refers to the type of order that has been determined by our analysts. Buy Limit, Sell Limit, Buy Stop & Sell Stop.
- Class: This refers to the type of asset for which the analysis has been published. We cover a range of assets including FX, Indices, Commodities, Cryptocurrency & Equities.
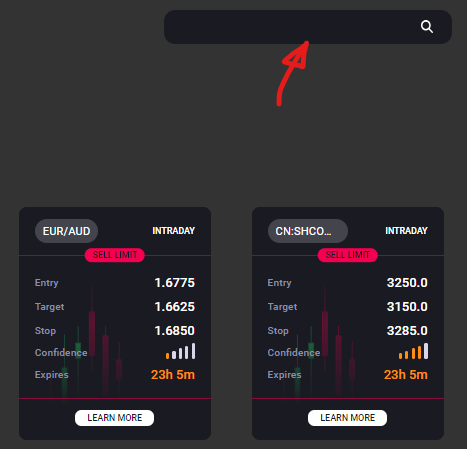
- Search: There is a simple search function on the top right, which will allow traders to quickly find markets/assets that are of most interest.
High quality, human led analysis
Clicking on the tile or the 'learn more' button expose more information about the trade idea.
Our aim here is to educate 'New Traders' by providing specific reasons why we believe this is a good trade idea.
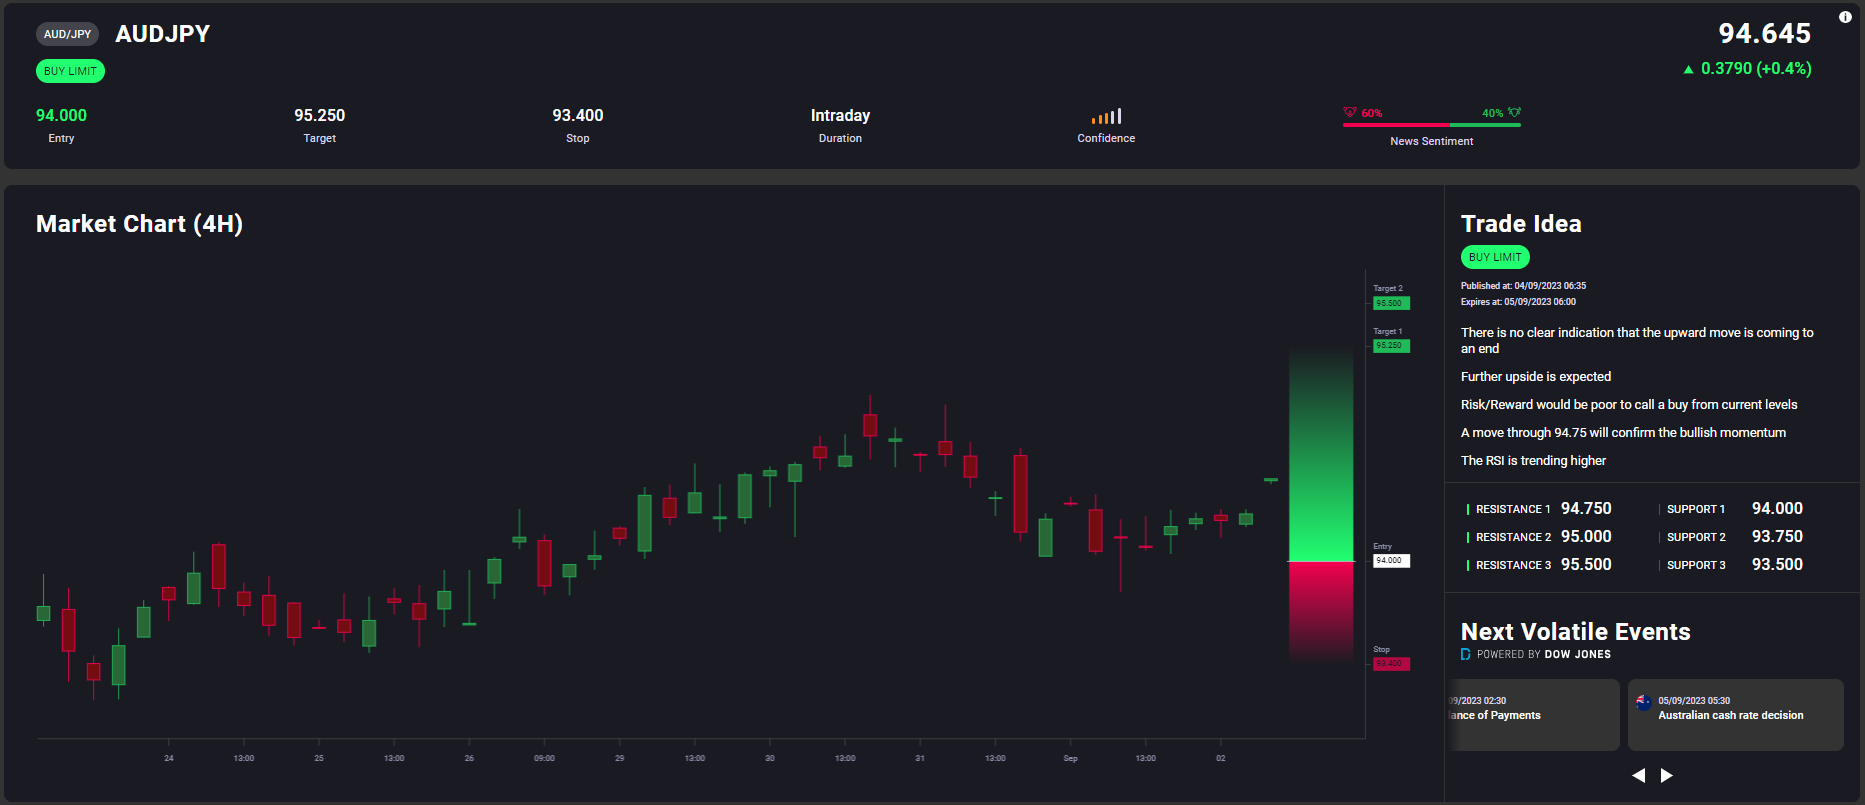
Additional information provided
- Specific call to action: e.g. Buy AUDJPY at 94.00
- Multiple take profit levels: Target 1 & Target 2
- News Sentiment: Visualise the current news sentiment concerning the asset selected
- Timestamps: Published times and expiry times
- 4 Hour candle chart: Visualise historic price action of the asset
- Visualisation of Risk/Reward: Green and Red image representing risk(red) and reward(green)
- Detailed rationale for the trade setup: Multiple phrases describing the trade setup
- Bespoke Support & Resistance levels: Important levels above and below the current price
- Next volatile events: Live feed from our economic calendar, highlighting events that are likely to directly impact the specific asset selected.
Trade!
Once armed with all of the information on the tile, the 'New Trader' is in a position to place a trade, having identified a specific asset of interest.
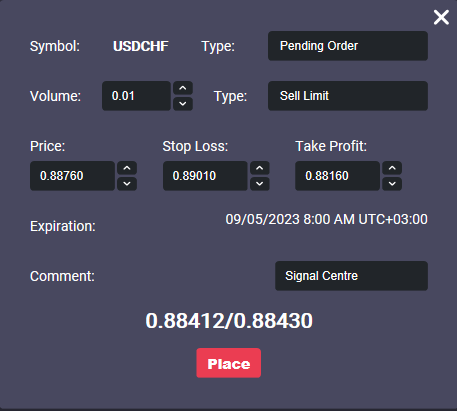
Call to action buttons are located throughout our tools and products to allow traders seamless access to trading opportunities that arise. In the Technical Analysis tool, deal tickets are pre-populated with the specific levels recommended in the analysis, providing 2-click trading functionality.
Experienced Traders
Typical characteristics of an experienced trader
Likely to have their own thoughts and ideas when it comes to trading. Sceptical of advice. Unlikely to be influenced by opinions. Likely to conduct deeper levels of research. Potentially curious about alternative opinions.
Below is an image of the expected journey a new trader will take using our Signals.
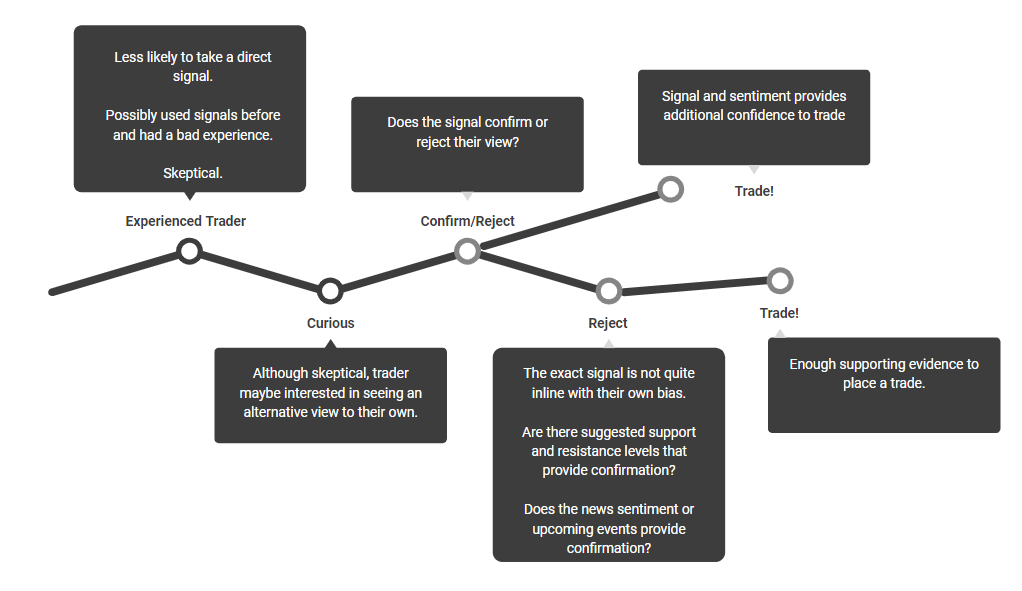
The first area an experienced trader will see is the Signals Home Page section.
The experienced trader is more likely to scroll down the page to find their asset of interest, or use a more direct approach by entering the asset of interest into the search box.
Does the analysis provided confirm or reject their own personal views?
If confirmation or validation is provided, then this could be enough of a trigger for a trade to be placed.
Alternatively, there are additional piece of information that can be used to validate their view.
- Direction bias: Does the direction (Buy/Sell) of the analysis support the traders view?
- News Sentiment: Does the direction of the news sentiment (Bullish/Bearish) of the asset support the traders view?
- Support & Resistance Levels: Do the support/resistance levels match up with their own analysis of the asset selected?
- Next Volatile Events: Does the calendar feed provide information they were not previously aware of, making trading conditions potentially better or worse?
Trade!
Although more experienced traders are likely to have their own views on certain markets. The information provided can help traders to validate those opinions, providing higher levels of conviction and improved decision making.
Call to action buttons are located throughout our tools and products to allow traders seamless access to trading opportunities that arise. In the Technical Analysis tool, deal tickets are pre-populated with the specific levels recommended in the analysis, providing 2-click trading functionality. These tickets are customisable allowing traders to edit the specific entry, exit and volume parameters to suit their trading styles.
If you haven't found what you're looking for yet, don't worry! Our team is here to assist you.